

AI agents need to call APIs, databases, and tools. But how do you give them access without embedding API keys or granting sweeping permissions?

Learn the design patterns behind secure agent access.
Join our Nov 18 live webinar, Agent Identity & Access: Building Secure Agentic Systems.
Explore credential brokering, scoped permissions, and short-lived sessions, with a demo of Infisical Agent Vault, a proxy that keeps API keys out of agents.
(Thanks to Infisical for partnering on this post.)
Building an AI agent is straightforward.
But running hundreds of agents reliably in production is HARD.
An agent might work perfectly during development, yet fail at scale in production. It could get stuck in a reasoning loop, call the wrong tool, exceed its token budget, or return an incorrect answer.
And when something goes wrong, you need to identify which step caused the failure.
Traditional application monitoring works, but AI agents create new challenges. Their execution paths vary, they make decisions at runtime, and a single user request could trigger multiple agents, tool calls, and model invocations.
This is where an AI agent harness comes into play.
An agent harness provides the infrastructure & controls around a Large Language Model (LLM) to manage its execution.
A production-ready agent harness includes these components:
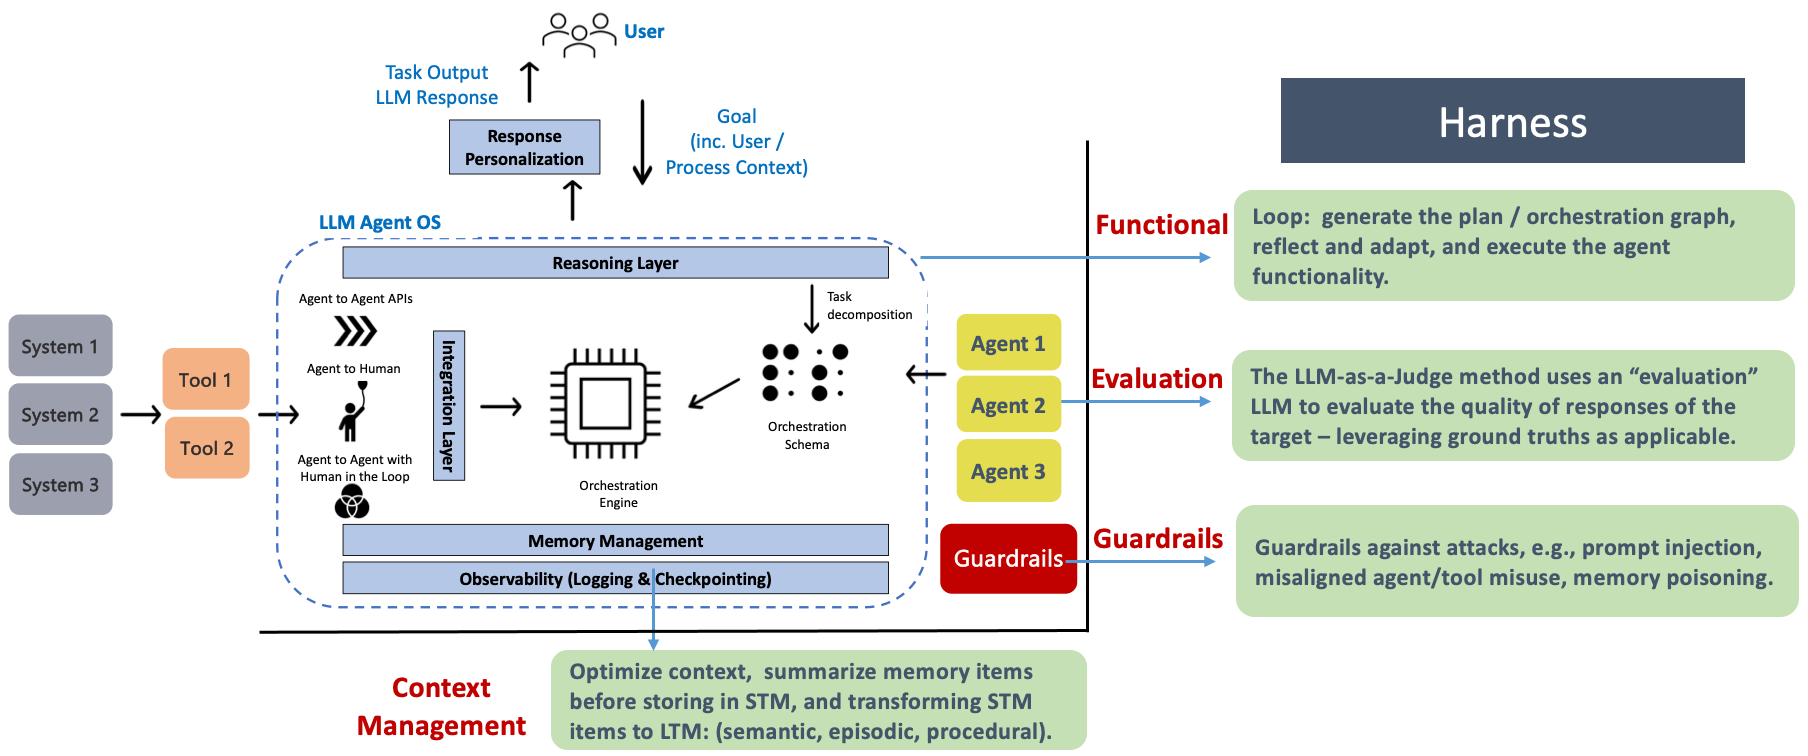
Reasoning loop: Plan tasks, execute actions, observe results, and adjust the execution plan when necessary.
Context and memory management: Manage the agent’s context window, preserve execution state, and retrieve relevant information from short-term or long-term memory.
Evaluations (Evals): Measure response quality, task completion, and agent behavior using ground-truth datasets, automated checks, or LLM-as-a-Judge.
Security: Enforce authentication, authorization, and access controls across applications, agents, tools, and data sources.
Guardrails: Detect and mitigate risks such as prompt injection, unauthorized tool use, and memory poisoning.
Human-in-the-loop (HITL): Allow users/operators to review decisions, approve sensitive actions, and intervene during execution.
These components make agent execution more reliable.
Yet you still need visibility into how agents behave once they enter production. That’s where observability becomes critical. You need to trace every agent execution, identify failures, measure response quality, and understand each workflow's cost.
Onward.
Here’s what’s inside:
Agentic AI architecture: How reasoning, orchestration, memory, and tools work together in an agentic system.
End-to-end observability: How to trace agent executions across models, tools, and external services.
OpenTelemetry: Which trace identifiers and attributes let you track agent behavior across distributed systems.
Agent evaluations: How to measure task success, response quality, and tool usage using telemetry and automated evaluations.
AI FinOps: How to estimate infrastructure and inference costs, measure token usage, and optimize agent performance at scale.
Share this letter & I’ll send you some rewards for the referrals.
Agentic AI Reference Architecture
For simple tasks, a single agent1 is enough…
But complex workflows require many specialized agents to work together.
Imagine an AI research assistant tasked with analyzing a company’s financial performance:
One agent retrieves financial reports,
Another agent analyzes the numbers,
And a third agent prepares the final summary.
An orchestration engine coordinates their execution & manage task dependencies.
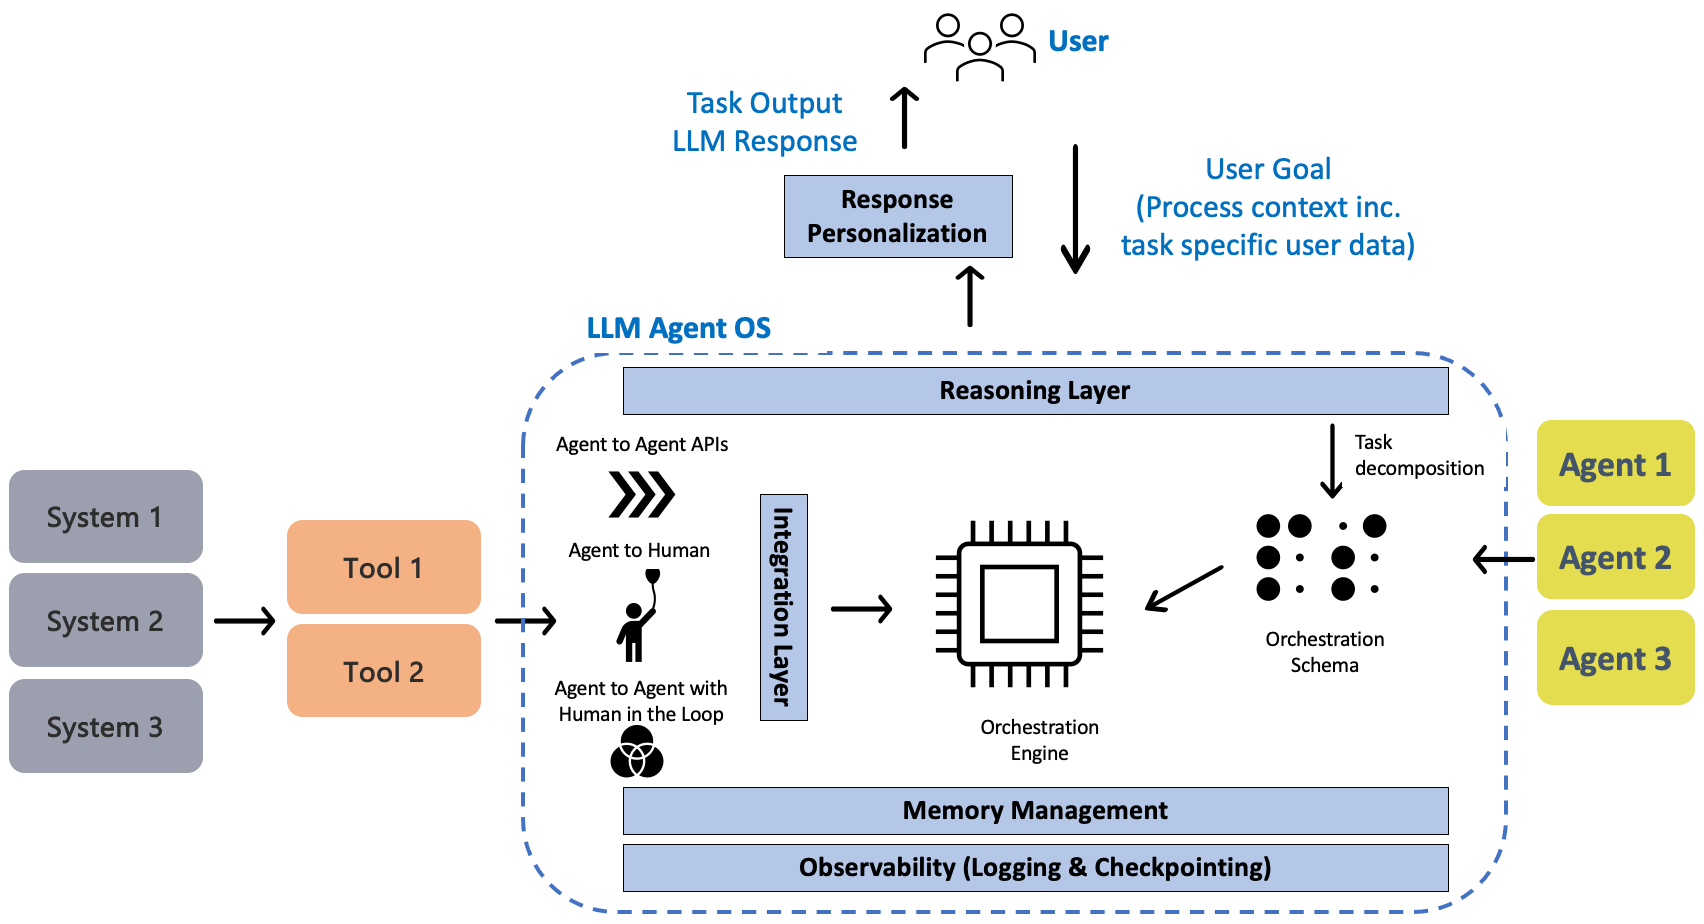
Let’s examine the key components:
1. Reasoning and Orchestration
The reasoning layer determines how an agent approaches a task.
For a complex request, the planner breaks the original goal into smaller subtasks. The orchestration engine then coordinates their execution, handles dependencies, and collects the results.
Here are two popular approaches that let agents reason and execute tasks:
Chain-of-Thought (CoT): A prompting technique that encourages a model to work through intermediate reasoning steps before producing an answer. It supports complex problem-solving but does not provide task orchestration.
Reasoning and Acting (ReAct): An agent pattern that alternates between reasoning, tool execution, and observations. The agent uses tool results to decide its next action and adjust its plan.
A research agent might search for a company’s annual report, extract its revenue figures, and calculate year-over-year growth. If the report is unavailable, the agent could choose another source.
The orchestration engine manages this execution flow, with retries, task dependencies, and termination conditions.
2. Agent Discovery and Composition
When multiple agents collaborate, the system needs a way to discover their capabilities and determine which agent should handle each task.
An agent registry maintains descriptions of available agents, their supported operations, and their access requirements.
The Agent2Agent (A2A) protocol provides a standardized way for agents to communicate and discover capabilities through an Agent Card.
An Agent Card is a JSON document containing this data:
Identity: Agent’s name, description, and provider information.
Service endpoint: The address where other apps/agents access its A2A service.
Capabilities: Supported features, such as streaming & push notifications.
Authentication: Security requirements for accessing the agent.
Skills: Tasks the agent supports, including descriptions, identifiers, and input/output formats.
An orchestration system discovers a financial analysis agent through its Agent Card and delegates a relevant task to it.
A2A supports interoperability between agents built using different frameworks.
A centralized marketplace is optional; agents could also be discovered through configured endpoints or registries.
3. Agent Integration and Tool Access
Once agents are selected, they need a way to communicate with other agents, applications, and external services.
The integration layer supports several interaction patterns:
Agent-to-agent: One agent delegates work to another through an API or an agent communication protocol.
Agent-to-application: An agent exchanges data with an application or returns results for users.
Human-to-agent: A user initiates a task or provides additional instructions.
Human-in-the-loop: An agent requests human approval/intervention before continuing a workflow.
The Model Context Protocol (MCP) provides a standardized interface for AI applications to interact with external systems.
MCP uses a client-server architecture and exposes three capabilities:
Resources: Data and contextual information exposed by an MCP server.
Tools: Functions an AI app could invoke to retrieve information or perform actions.
Prompts: Reusable prompt templates exposed by an MCP server.
A research agent could use an MCP server to retrieve documents from an enterprise knowledge base. Another tool could query a database or create a report.
MCP standardizes interactions between AI apps and external capabilities, while A2A focuses on communication between agents.
Both protocols could coexist within the same architecture.
4. Context and Memory Management
Complex agents execute multiple steps over extended periods.
So they need to preserve relevant information between actions and across separate sessions.
Memory management lets agents maintain context without repeatedly processing the entire interaction history.
Here are three key components:
Working context: Information currently available within the model’s context window--instructions, recent messages, and tool results.
Execution state: Persistent information about workflow progress, completed tasks, pending actions, and checkpoints.
Long-term memory: Information retained across interactions, such as user preferences, past outcomes, or retrieved knowledge.
For semantic memory2, one common approach is to convert text into numerical representations called embeddings and store them in a vector database.
The database retrieves semantically similar information using similarity measures such as cosine similarity or inner product.
At scale, Approximate Nearest Neighbor (ANN) search accelerates retrieval by trading some accuracy for faster searches. Maximum Inner Product Search (MIPS3) is one possible retrieval objective.
Yet vector databases are only one part of memory management.
Execution state belongs in a durable database or checkpoint store. Structured records and conversation histories use other storage systems.
The architecture should select the appropriate storage mechanism based on the memory type and how the agent needs to access it.
5. Security, Governance, and Guardrails
AI agents interact with external systems and perform actions on behalf of users.
This creates security risks when agents access sensitive information or invoke tools that modify data.
So a production architecture needs security controls at multiple levels:
I) Authentication and authorization
Agents should access only the resources & operations required for their tasks.
A financial analysis agent might need permission to read financial records but should not automatically receive permission to modify them.
The underlying services and tools must enforce authorization, rather than relying solely on instructions provided to the model.
II) Agent-specific guardrails
Guardrails detect/prevent unsafe behaviors:
Unauthorized/inappropriate tool execution.
Memory poisoning through malicious stored information.
Sensitive data exposure across users, agents, or sessions.
Prompt injection through untrusted documents or tool responses.
Human approval is another important control for high-risk operations, such as financial transactions or changes to production infrastructure.
A central governance layer lets you define policies and monitor compliance. Yet individual components must enforce the controls relevant to their responsibilities.
A tool gateway should validate permissions before executing an action, while the memory layer should enforce access controls when retrieving stored information.
This architecture establishes how agents execute tasks and interact with external systems.
The next challenge is understanding what happens during execution.
When an agent produces an “incorrect” result, you need to identify whether the failure originated in its reasoning, tool execution, retrieved context, or an external service.
That’s where end-to-end observability becomes critical…
Agentic AI Observability Layer
Traditional applications follow predefined execution paths.
AI agents add complexity because their decisions, tool calls, and execution paths can vary from run to run.
Imagine a research agent tasked with analyzing a company’s financial performance:
During one execution, it retrieves an annual report and extracts the required figures. During another, it might search many sources, retry a failed API call, or delegate the analysis to another agent.
Both executions would produce the same answer, but their latency, resource usage, and costs differ.
So you need end-to-end observability to understand what happens inside each agent execution.

This visibility offers these capabilities:
End-to-end tracing: Track the complete execution path across user requests, agent decisions, model invocations, tool calls, and external services.
Failure analysis: Identify the source of errors, incorrect outputs, latency spikes, or unexpected costs. Traces provide diagnostic evidence, while evaluations allow assessing response quality.
Auditability and governance: Record execution history, policy decisions, guardrail outcomes, and resource usage. Durable audit records with appropriate integrity controls support compliance and accountability.
Continuous improvement: Use execution data and evaluation results to identify inefficient workflows, improve prompts, refine agent logic, and measure the impact of changes.
If an agent takes 30 seconds to complete a task, a distributed trace could reveal 20 seconds were spent waiting for an external API.
You could then optimize the slow dependency instead of changing the model or rewriting the agent’s reasoning logic.
But observability should begin before an agent reaches production.
Build-Time vs Runtime Observability
Agentic AI systems require visibility during development and production lifecycle.
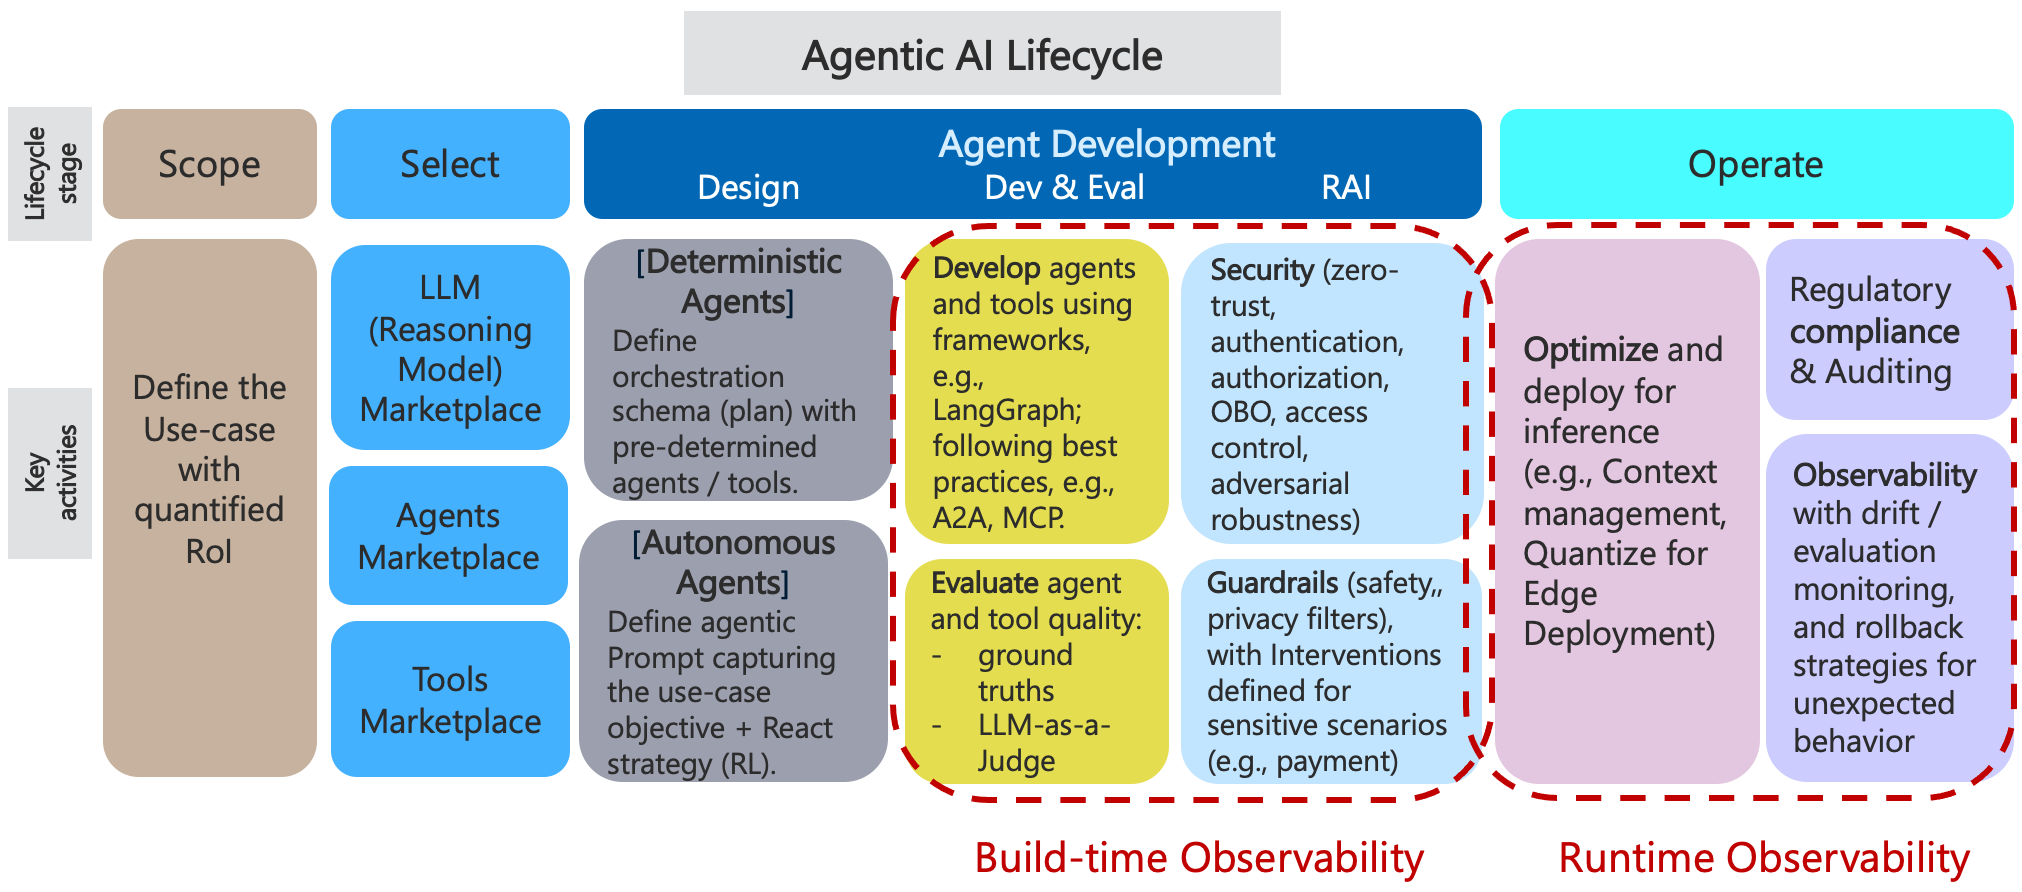
1. Build-Time Observability
Build-time observability focuses on examining system behavior during development, testing, and pre-deployment validation.
It combines telemetry from test executions with evaluation results and system configuration checks.
Agent evaluation: Test whether agents complete expected tasks using predefined datasets and success criteria.
Tool validation: Verify that agents select correct tools, provide valid parameters, and handle failures.
Performance testing: Measure latency, token consumption, and resource usage under representative workloads.
Security validation: Test access controls, guardrails, and resistance to prompt injection or unauthorized tool execution.
You could run a research agent against 100 predefined tasks and measure its task completion rate, tool call accuracy, and average execution cost.
These results establish a baseline before deployment.
Yet passing pre-deployment tests does not guarantee reliable behavior in production.
2. Runtime Observability
Runtime observability tracks how agents behave during actual execution.
It relies on three core telemetry signals:
Logs: Record discrete events such as tool failures, policy decisions, and execution errors.
Metrics: Measure numerical indicators such as request latency, token consumption, error rates, and cost per task.
Traces: Connect operations across agents, models, tools, and external services to reconstruct execution paths.
These signals let you investigate failures and monitor production performance.
An agent could repeatedly invoke the same tool without making progress. A trace would reveal the repeated calls, while metrics could show the resulting increase in latency and token consumption.
This matters because agent behavior could change based on user inputs, retrieved information, and intermediate tool results.
Runtime monitoring lets you identify these risks:
Goal drift: The agent gradually deviates from the original task.
Recursive loops: Repeated reasoning or tool calls prevent the workflow from completing.
Unexpected tool execution: The agent invokes unnecessary or inappropriate operations.
Cost overruns: Excessive model calls or retries consume more resources than expected.
Observability detects and investigates these behaviors.
Enforcing execution limits, permissions, and safety policies requires extra controls within the agent architecture.
Build-time evaluation establishes expected behavior. Runtime observability reveals how the agent performs under real workloads. Thus providing the evidence needed to improve agent reliability and operational efficiency.
The next step is to connect these observations across distributed components.
OpenTelemetry collects and correlates telemetry from agent executions, model invocations, and tool calls.
OpenTelemetry for AI Agent Observability
When an AI agent executes a task, it could invoke multiple models, call external tools, and delegate work to other agents.
Each operation generates telemetry.
But without a common way to connect these events, identifying the cause of a failure becomes hard.
OpenTelemetry (OTel) provides a vendor-neutral framework for collecting and exporting traces, metrics, and logs across distributed systems.
Distributed tracing lets you reconstruct a task's execution path and understand where time and resources were spent in agentic AI.
1. Core Tracing Principles
Before instrumenting an agentic system, you need a consistent approach to tracing operations across components.
Here are four principles to establish the foundation:
Standardized trace propagation: Use the World Wide Web Consortium (W3C) Trace Context standard to propagate tracing information4 across services.
One task, multiple spans: Represent an AI task with a trace. Each model invocation, tool call, or agent operation becomes a span. Record retries as separate operations to preserve their execution history.
Span links for related operations: Use span5 links to connect operations with non-hierarchical relationships, such as asynchronous jobs or workflows that cross trace boundaries. Parent-child relationships remain appropriate for ordinary parallel operations within a trace.
Opaque identifiers: Keep trace and span identifiers free of business meaning. Store task details, agent names, and other contextual information in attributes.
These principles maintain consistent tracing across agent frameworks and external services.
2. Trace Identifiers and Relationships
OpenTelemetry uses traces and spans to represent distributed operations.
A trace represents the execution path of a request/operation. Each span records an individual operation within that trace.
Here are four important identifiers and relationships:
trace_id: Identifies a trace and connects related spans across services.span_id: Uniquely identifies a span within its trace.parent_span_id: Identifies the parent span, establishing the execution hierarchy.Span links: Associate a span with other span contexts, including operations in separate traces.
Imagine an AI research agent that receives a request, retrieves documents, and generates a summary.
The execution could produce the following trace:
TRACE: Research Task
Trace ID: 4bf92f3577b34da6a3ce929d0e0e4736
Start: 10:00:00.000
End:   10:00:02.500
Duration: 2500 ms
│
└── SPAN 1: HTTP POST /research
    │   Span ID: a1 (shortened)
    │   Parent Span ID: None (root)
    │   Start: 10:00:00.000
    │   End:   10:00:02.500
    │   Duration: 2500 ms
    │   Attributes: http.request.method=POST
    │   Status: UNSET
    │   Events: None
    │
    └── SPAN 2: Agent: Research Agent
        │   Span ID: b2
        │   Parent Span ID: a1
        │   Start: 10:00:00.050
        │   End:   10:00:02.400
        │   Duration: 2350 ms
        │   Attributes: gen_ai.agent.name=research_agent
        │   Status: UNSET
        │   Events: None
        │
        ├── SPAN 3: LLM: Generate Plan
        │   Span ID: c3
        │   Parent Span ID: b2
        │   Start: 10:00:00.100
        │   End:   10:00:00.600
        │   Duration: 500 ms
        │   Attributes: gen_ai.request.model=gpt-6
        │   Status: UNSET
        │   Events: None
        │
        ├── SPAN 4: Tool: Search Documents
        │   Span ID: d4
        │   Parent Span ID: b2
        │   Start: 10:00:00.650
        │   End:   10:00:01.100
        │   Duration: 450 ms
        │   Attributes: gen_ai.tool.name=search_documents
        │   Status: UNSET
        │   Events: None
        │   │
        │   └── SPAN 5: HTTP: Search API
        │       Span ID: e5
        │       Parent Span ID: d4
        │       Start: 10:00:00.700
        │       End:   10:00:01.050
        │       Duration: 350 ms
        │       Attributes: http.request.method=GET
        │       Status: UNSET
        │       Events: None
        │
        ├── SPAN 6: Tool: Retrieve Report
        │   Span ID: f6
        │   Parent Span ID: b2
        │   Start: 10:00:01.150
        │   End:   10:00:01.550
        │   Duration: 400 ms
        │   Attributes: gen_ai.tool.name=retrieve_report
        │   Status: UNSET
        │   Events: None
        │   │
        │   └── SPAN 7: HTTP: Document API
        │       Span ID: g7
        │       Parent Span ID: f6
        │       Start: 10:00:01.200
        │       End:   10:00:01.500
        │       Duration: 300 ms
        │       Attributes: http.response.status_code=200
        │       Status: UNSET
        │       Events: None
        │
        └── SPAN 8: LLM: Generate Summary
            Span ID: h8
            Parent Span ID: b2
            Start: 10:00:01.600
            End:   10:00:02.300
            Duration: 700 ms
            Attributes: gen_ai.request.model=gpt-6
            Status: UNSET
            Events: None
Each operation has its own span, while the spans share a common trace ID.
If document retrieval fails, you inspect the corresponding span to identify the error, execution duration, and affected service.
For long-running workflows, a single task could span multiple traces. In such cases, a separate task or workflow identifier correlates executions across trace boundaries.
3. OpenTelemetry Attributes for AI Agents
Trace identifiers show how operations connect.
Span attributes describe what happened during each operation.
For agentic AI systems, here are the categories of useful attributes:
Agent execution: Agent name, operation type, execution status, and workflow identifiers.
Model invocation: Model provider, model name, token usage, and inference-related information.
Tool execution: Tool name, operation details, execution status, and errors.
Performance: Operation duration, request latency, and other performance measurements.
Governance: Guardrail outcomes, policy decisions, and relevant audit references.
OpenTelemetry provides Generative AI semantic conventions for several model, agent, and tool operations.
Additional application-specific attributes should be necessary for workflow state, governance, and cost attribution.
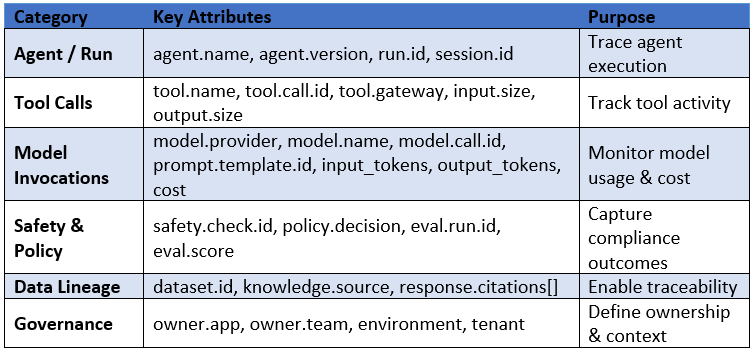
Use standardized OpenTelemetry attributes wherever applicable.
Define custom attributes only when existing conventions do not cover required information.
4. Trace Correlation and Auditability
Once you collect the relevant spans and attributes, you can reconstruct an AI task's execution history.
A trace reveals:
Which agent received the original request.
Which model generated the execution plan.
Where retries, errors, or latency spikes occurred.
Which tools were invoked and whether they succeeded.
How many tokens were consumed during model invocations.
This information lets you identify failures, analyze resource usage, and investigate unexpected agent behavior.
Yet telemetry alone does not guarantee a complete or tamper-proof audit trail. Production systems need proper retention policies, access controls, and integrity protections.
Plus, you must avoid recording sensitive prompts, credentials, or personal information in telemetry unless explicitly required and properly protected.
The next section explores how to turn agent traces and logs into evaluation datasets to measure task success, response quality, and tool utilization.
Agentic Evaluation and Optimization
Observability tells you what happened during an agent’s execution.
Evaluation determines whether the agent performed its task correctly.
A research agent could successfully call every tool and generate a response within two seconds. Yet the response could contain incorrect financial figures or miss crucial information from retrieved documents.
Traditional performance metrics, such as latency and error rates, would not reveal these quality issues. So you need agent-specific evaluations to measure task success, response quality, and tool usage.
Let’s examine key metrics:
1. Agent Efficiency
Agent efficiency measures how effectively an agent completes its assigned task.
Some metrics evaluate the final response, while others assess intermediate actions and execution behavior.
Task and reasoning quality
Task success rate: Measures the percentage of tasks completed according to predefined success criteria. This is one of the most important indicators of agent effectiveness.
Reasoning relevance: Evaluates whether the agent’s observable plans and actions align with the user’s request.
Reasoning coherence: Asses whether agent’s observable planning steps follow a logical sequence without unnecessary or contradictory actions.
Task decomposition efficiency: Measures how effectively an agent divides complex tasks into manageable subtasks, considering dependencies and unnecessary steps.
Reasoning-based metrics require access to explicit plans or other observable reasoning artifacts.
Many “hosted” models do not expose their internal reasoning, so evaluations should focus on available execution evidence.
Response quality
Answer relevance: Measures whether response address user’s original request.
Groundedness: Evaluates whether claims in the response are supported by the retrieved documents or trusted evidence.
Response fluency: Assesses grammar, readability, and natural language quality.
Response coherence: Measures whether the response is logically structured and internally consistent.
An agent could produce a fluent financial summary while reporting incorrect revenue figures. Its fluency score might be high, but its groundedness and factual accuracy scores would be low.
Reliability and consistency
Agent robustness: Measures how reliably an agent handles unexpected inputs, tool failures, and adversarial scenarios.
Agent consistency: Evaluates whether repeated executions with similar inputs produce results that satisfy the same correctness criteria.
These metrics identify cases where an agent appears successful but produces unreliable outcomes.
2. Tool Utilization Efficiency
AI agents depend on external tools to retrieve information and perform actions.
Choosing the wrong tool, passing invalid parameters, or making unnecessary calls increases latency and cost.
Here are four metrics to evaluate tool usage:
Tool selection accuracy: Measures how often the agent selects an appropriate tool for the task.
Tool usage efficiency: Evaluates whether the agent completes its work with a reasonable number of tool calls and minimal unnecessary operations.
Tool call precision: Measures whether the arguments passed to a tool are valid and appropriate for the requested operation.
Tool call success rate: Measures the percentage of tool invocations that complete successfully.
Imagine a research agent that needs to retrieve a company’s annual report.
The agent could invoke the document search tool five times with different queries before retrieving the correct report.
All five calls might succeed technically, resulting in a 100% tool call success rate. Yet the agent’s tool usage efficiency would be poor because several calls were unnecessary.
To measure these metrics accurately, you need evaluation criteria, expected outcomes, or reference examples. Execution logs alone don't show whether a tool was the best choice.
3. OpenTelemetry-Based Evaluation Architecture
Once you define the evaluation metrics, the next step is to collect execution data and evaluate agent behavior.
OpenTelemetry provides traces, logs, and metrics to reconstruct agent executions across models, tools, and external services.
These telemetry signals could support two evaluation approaches:
Offline evaluation
Offline evaluation analyzes previously recorded executions or runs agents against predefined test datasets.
An evaluation service retrieves relevant traces and logs, reconstructs the execution history, and calculates quality metrics.
This approach supports:
Analysis of failed production interactions.
Regression testing after prompt/model changes.
Identification of recurring tool usage or response quality issues.
Comparison of agent versions using the same evaluation dataset.
Offline evaluation does not require evaluation service to run inside live request path.
Online evaluation
Online evaluation assesses agent behavior during production execution.
The application or telemetry pipeline sends relevant execution artifacts to an evaluation service. The service then calculates selected metrics and records the results.
You could evaluate a sample of production responses for groundedness and flag low-scoring interactions for further investigation.
Online evaluations run synchronously when immediate validation is required or asynchronously to avoid increasing user-facing latency.
Both approaches rely on evaluation criteria and access to necessary execution artifacts.
4. Offline Evaluation Architecture
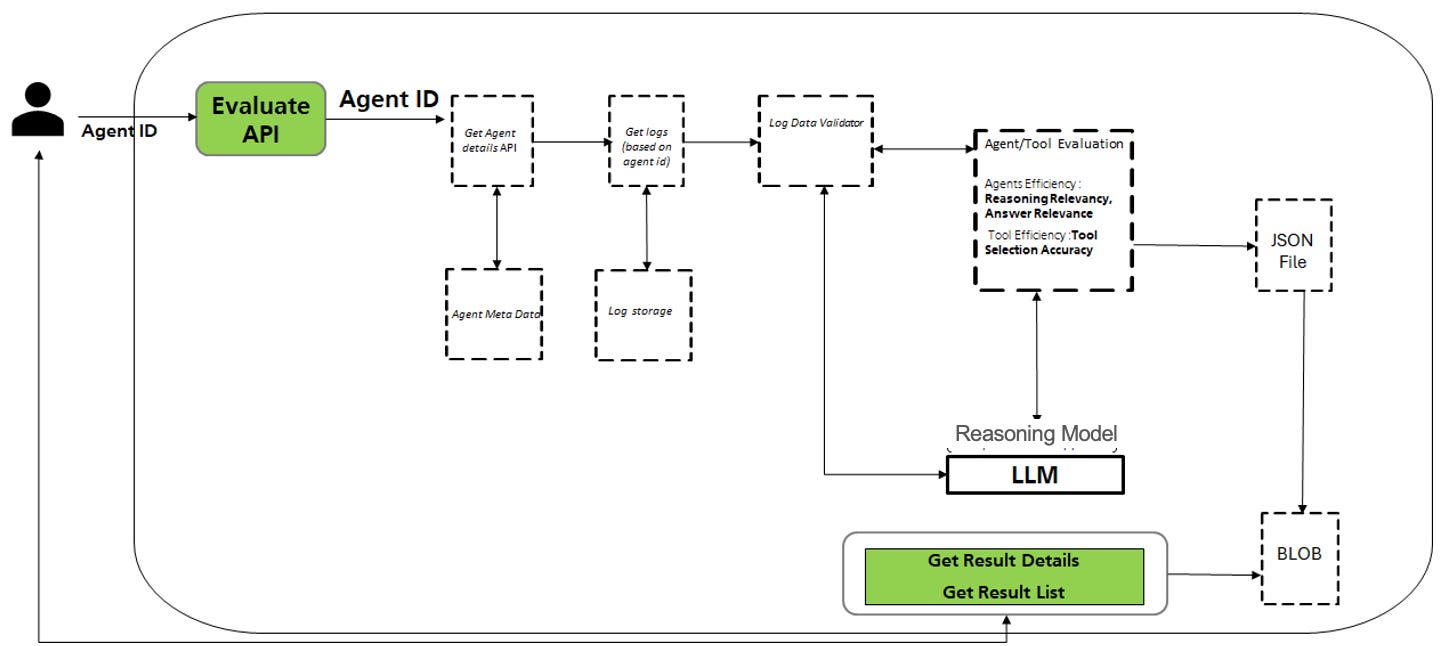
The evaluation process follows four steps:
Step 1: Trigger Evaluation
A user or automated workflow initiates an evaluation through the Evaluate API.
The request specifies the evaluation scope:
Agent name or identifier.
Tool descriptions or relevant tool metadata.
Date range for retrieving previous interactions.
Selected evaluation metrics, such as tool selection accuracy or answer relevance.
Depending on the selected metrics, the evaluator would require reference answers, expected tool calls, or ground-truth data.
Step 2: Retrieve Agent Interactions
The evaluation service queries the telemetry backend to retrieve agent executions.
OpenTelemetry trace identifiers correlate operations within each execution, including model invocations, tool calls, and errors.
The evaluator reconstructs the available execution history from these records. It retrieves the model response, selected tool, tool arguments, and execution outcome for a specific research task.
The required data must have been captured during execution. Standard telemetry does not automatically contain every prompt, response, or evaluation artifact.
Step 3: Evaluate Agent Performance
The evaluation engine analyzes retrieved interactions using selected evaluation methods.
One approach is LLM-as-a-Judge, where a language model evaluates an agent’s output against predefined criteria.
The evaluator assesses whether a generated financial summary accurately reflects the retrieved annual report. Other metrics could use deterministic checks, reference answers, or direct comparisons with expected tool calls.
The evaluation engine then generates:
A score for each selected metric.
Supporting evidence for the result.
An overall evaluation result, where applicable.
The results are stored in persistent storage, such as object or Blob storage, for later analysis.
LLM-based scores should be validated against human-reviewed examples to assess their reliability.
Step 4: Publish Evaluation Results
Users retrieve evaluation results through these APIs:
Get ResultList API: Returns a summary of evaluation runs, including their status and aggregate scores.
Get ResultDetails API: Returns detailed scores, supporting evidence, and explanations for individual interactions and metrics.
These results let you compare agent versions, investigate failures, and identify improvement opportunities.
If a new prompt increases task success but doubles the average number of tool calls, you can compare the quality improvement against the added cost.
Once you understand how effectively an agent performs its tasks, the next question is how much each execution costs.
This brings us to FinOps for agentic AI systems.
OpenTelemetry-based Agentic AI FinOps
Running AI agents in production creates costs beyond individual model requests.
An agent might invoke a language model several times, retrieve documents from a vector database, call external APIs, and delegate tasks to other agents before producing a final response.
Each operation consumes resources.
FinOps lets you understand these costs and make informed decisions about infrastructure, model selection, and resource allocation.
For agentic AI systems, the goal is to measure the cost of each execution and optimize spending without compromising task quality or reliability.
OpenTelemetry (OTel) provides execution data that links resource consumption to individual agent workflows.
Let’s examine the three crucial dimensions of agentic AI costs: