

Download the “Multitenant Authorization” eBook for free

Most SaaS products start with Admin, Editor, and Viewer.
Then a 30,000-person enterprise signs up with matrix reporting, regional compliance, and its own idea of who sees what. Custom roles pile up per tenant, and deals stall on access rules your model can’t express.
This 50+ page guide by Cerbos co-founder Emre Baran shows how to implement authorization that fits each tenant without adding roles for every customer.
Why fixed roles break at enterprise scale, and what role explosion looks like
Letting customers manage their own roles with delegated admin
Keeping each tenant’s policies apart from platform-wide rules and out of your application code
Real examples from leading SaaS companies scaling authorization across thousands of tenants
Useful if you’re building multitenant SaaS or about to sign one of your first large enterprise customers.
(Thanks to Cerbos for partnering on this newsletter.)
Picture yourself starting a new software project.
You search the codebase for a function, class, and/or configuration file. But finding those pieces is only half the job…
You need to understand how they connect:
Which service calls this function?
Which database it depend on?
Which business rule affects the result?
AI systems face a similar problem.
Traditional Retrieval-Augmented Generation (RAG) retrieves relevant chunks from a large document collection. But what happens when many documents contain parts of the answer, and the true answer depends on their relationships?
That is where GraphRAG takes a unique approach:
It connects information instead of seeing it as separate pieces. It links entities, concepts, people, events & documents into a knowledge graph. Now the system searches for relevant information and follows connections between them.
Onward.
Share this letter & I’ll send you some rewards for the referrals.
§
Here’s what you'll find in this newsletter:
Why finding the right text isn’t always enough: where traditional RAG and vector search fall short when an answer depends on relationships between people, documents, concepts, and events.
How GraphRAG connects the dots. How knowledge graphs turn scattered information into connected knowledge, and how GraphRAG uses those connections to retrieve better answers.
How GraphRAG finds the right path: From graph queries and traversal to local, global, multi-hop, path, and community-based retrieval. Learn why different questions need different paths.
How you know GraphRAG actually works. How to assess retrieval for relevance, faithfulness, completeness, speed, and overall quality, and what happens when the graph grows very large.
What happens when RAG starts making decisions. How Agentic RAG moves beyond a fixed retrieval pipeline by choosing retrieval strategies, tools, and sources based on the question.
Onward.
§
RAG
RAG is a key method for enterprise apps.
It gives Large Language Models (LLMs) access to information outside their training data. It gathers relevant content from sources such as company documents, knowledge bases & databases. Then it forwards that information to the LLM to generate a response.
Let’s break down what RAG is:
Retrieval: Locate information from an outside source
Augmented: Add information that was retrieved to the model context
Generation: Generate an answer based on provided context using LLM
Think of RAG as an information desk for an LLM.
The retrieval system finds the information and gives it to the LLM so it can answer the question.
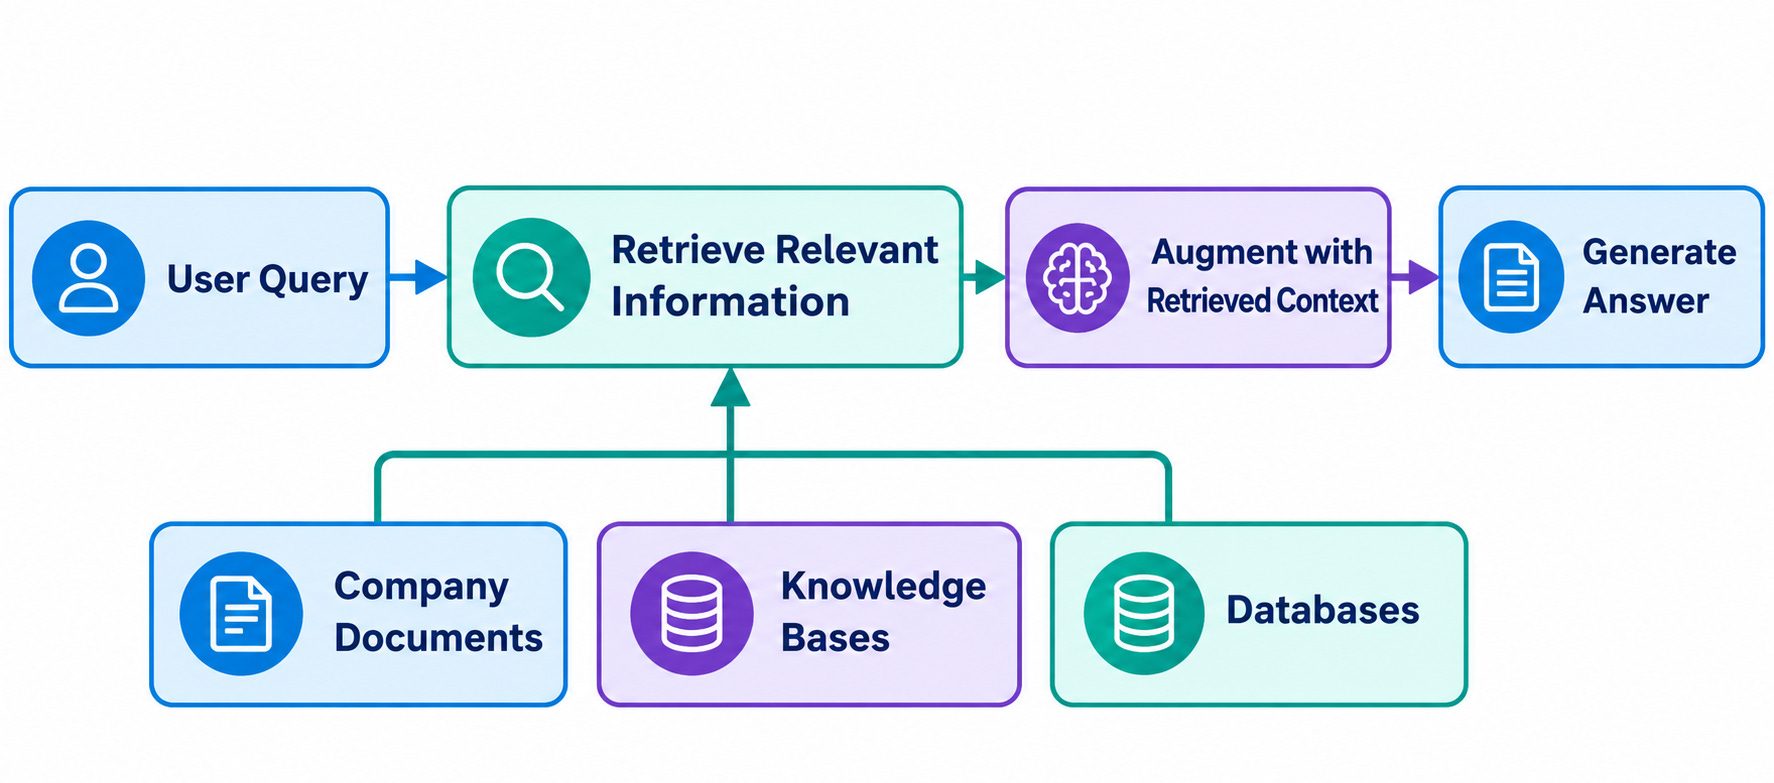
Let’s look at the standard RAG pipeline (step by step)…
How Standard RAG Works
There are 2 phases in a RAG system:
Indexing stage (onetime/periodic)
Query stage (for queries from the user)
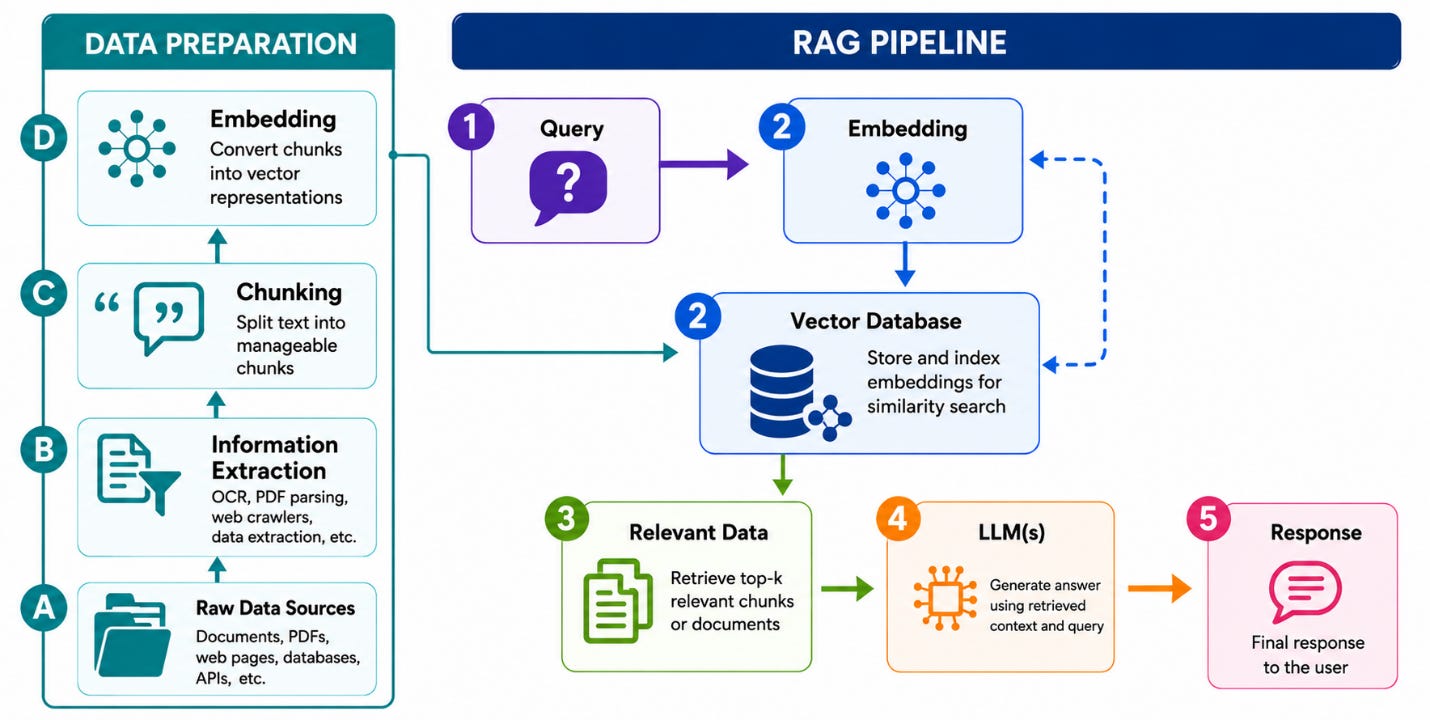
Phase 1: Indexing Stage
Let’s walk through key steps in a RAG pipeline:
Step A: Get the documents you want the system to use as references.
This could be:
Legal documents, precedents, agreements & decisions
Literature & clinical guidelines
Documentation, code repositories, or API documentation
Customer support tickets & FAQ databases
Step B: Extract useful, machine-readable content from raw sources.
This includes PDFs, documents, web pages, and databases. It uses PDF parsers, web crawlers, and optical character recognition (OCR) tools.
Step C: Chunk the documents.
Even the latest LLM models have a small context window (even 1M tokens don’t mean you can feed your entire knowledge base into each prompt!). So break documents into tiny pieces, typically 200-1000 tokens long.
Split text into fixed-size chunks, semantic chunks, or recursive chunks.
Fixed-size chunking divides text into equal-length pieces.
Semantic chunking gathers related content.
Recursive chunking breaks text into smaller parts step by step.
Step D: These chunks enter an embedding model.
The neural network turns each chunk into a dense numerical vector with 768 to 1,536 elements. These vectors depict meaning. The system will cluster similar-looking chunks together, even when they use different words.
Here are the popular embedding models:
Cohere’s embed-v3
Voyage AI’s voyage-large-2
OpenAI’s text-embedding-3-large
Open-source solutions such as BGE, E5 & GTE
A vector database1 stores these embeddings & enables fast similarity searches.
Phase 2: Query Stage
Let’s see how to find information relevant to a user’s query…
Step 1: When a user asks a question, the system creates an embedding.
This guarantees the query vector is in the same semantic space as the document vectors.
Step 2: The system then sends the query embedding to the vector database.
The database checks the query vector against the stored document vectors. It then identifies the most semantically similar chunks.
Step 3: The vector database runs k-nearest neighbors (k-NN) search to identify the K document chunks closest to the query embedding.
Here are the typical measures of similarity:
Cosine similarity: Measures the angle between two vectors. The closer their directions, the more similar their embeddings.
Dot product: Fast to compute, appropriate for normalized vectors.
Euclidean distance: Measures straight-line distance.
Yet exact k-NN search is too expensive at scale.
Vector databases enable billion-scale searches in milliseconds using approximate nearest neighbor (ANN) methods. These include Hierarchical Navigable Small World (HNSW) graphs & Inverted File Index (IVF).
Step 4: Prompt construction.
The prompt includes the retrieved chunks inserted in the following format:
You are a helpful assistant.

Answer the user’s question using only the information
provided in the context below.
Step 5: The system provides the LLM with the prompt and extra context.
Then, the LLM creates a response based on the information it has retrieved. A successful RAG implementation must have the model reference its sources.
This enables verification & builds trust.
Thus, LLM answers questions it has NOT encountered before, such as your company’s internal documents, research papers, customer tickets, and so on.
RAG would find the right pieces of information but miss the relationships between them. And when the answer depends on those connections, simply finding relevant chunks is NOT enough.
Problems with Standard RAG
As data size grows, vector search becomes less accurate. (The accuracy could drop by 12% when the collection grows from 10,000 to 100,000 pages.)
The more documents you add, the more the embeddings overlap, and the more difficult the system will find it to locate the right chunks.
But scaling is not the entire story…
Standard RAG has two fundamental limitations, and they become HARD to ignore as the system grows:
1. Chunks are treated as separate
Once the system chunks & embeds a document, it converts the document into individual, independent vectors.
With RAG, there is no explicit link between chunks (even within the same/different documents). Vector search finds relevant chunks based on vector similarity.
This makes it harder to connect related facts across documents.
2. RAG cannot reason across documents
Some questions require information from many documents/sources.
RAG retrieves information chunks relevant to the question. Yet it does not link these chunks to show their relationships. This makes it hard to ask questions about the entire document collection.
These limitations make it harder for standard RAG to connect related information across chunks & documents…This is where GraphRAG takes retrieval a step further!
§
GraphRAG
GraphRAG adds structure to your documents and does NOT treat them as disjointed chunks in vector space.
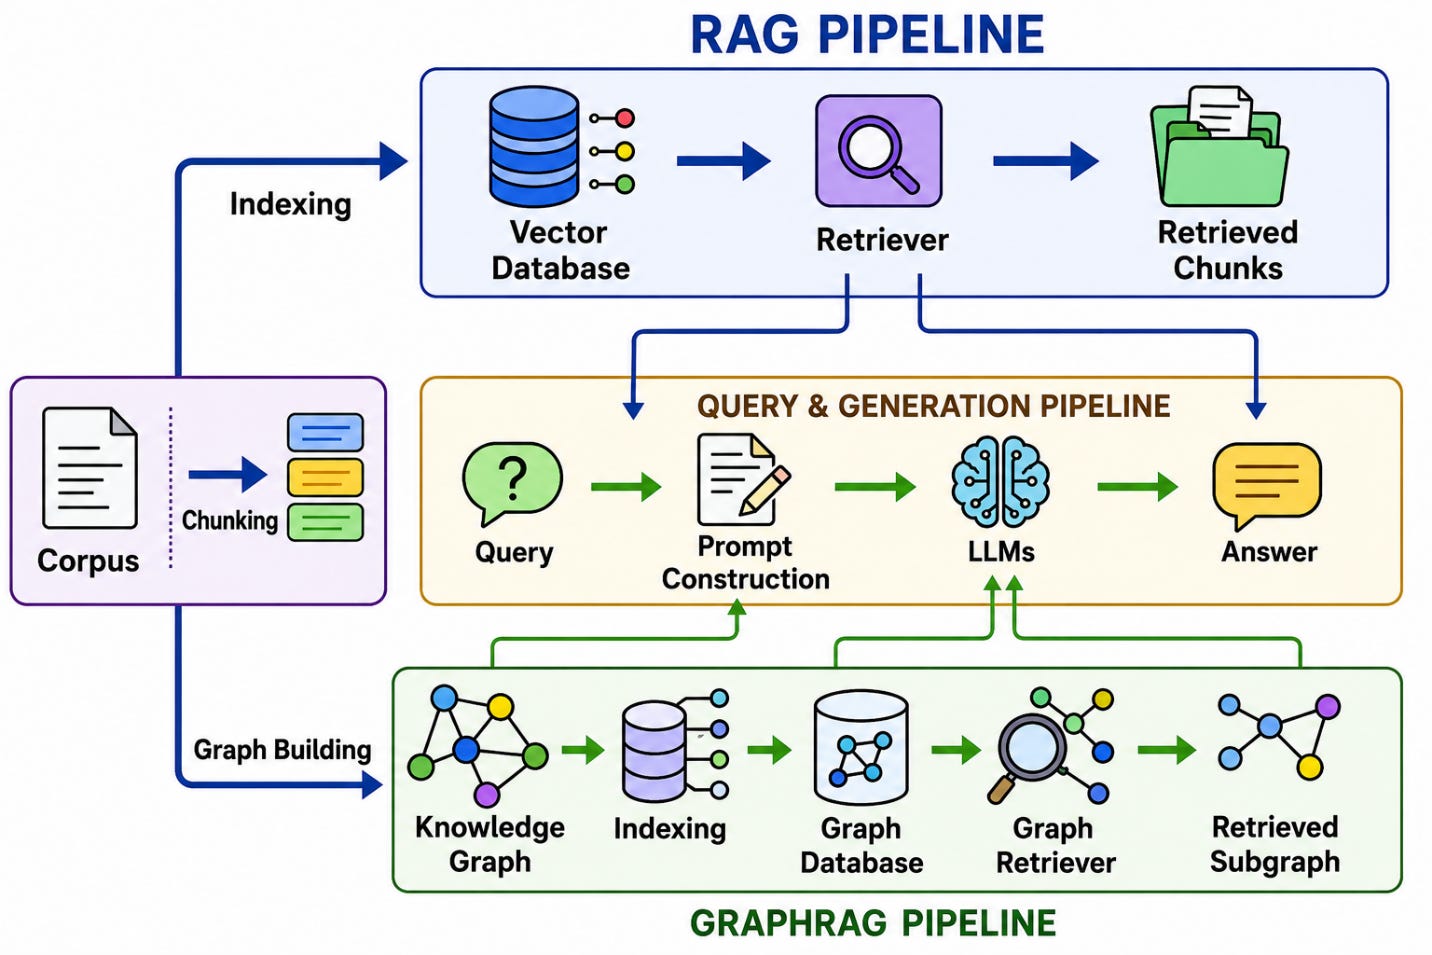
An LLM processes each piece of text, identifies entities2, and the relationships between them. These entities become nodes in a knowledge graph, and the relationships become edges connecting these nodes.
So you end up with a neat graph of your entire dataset, showing how your data is related in reality across documents.
GraphRAG does more than match text to your query:
It infers facts from related entities. Plus, it traces facts across documents & find information spread across various texts. And answers questions about the entire dataset.
Let’s follow the journey from raw documents to a searchable knowledge graph…
How GraphRAG Works
It has two phases:
Indexing Stage (constructing knowledge graph)
Query Stage (retrieving from the knowledge graph)
Let’s dive straight in!
The general pipeline has two extra steps:
Community detection: groups related entities into clusters. For example, people, companies, and products that frequently connect.
Community summarization: An LLM creates a short report with the important information inside each community.
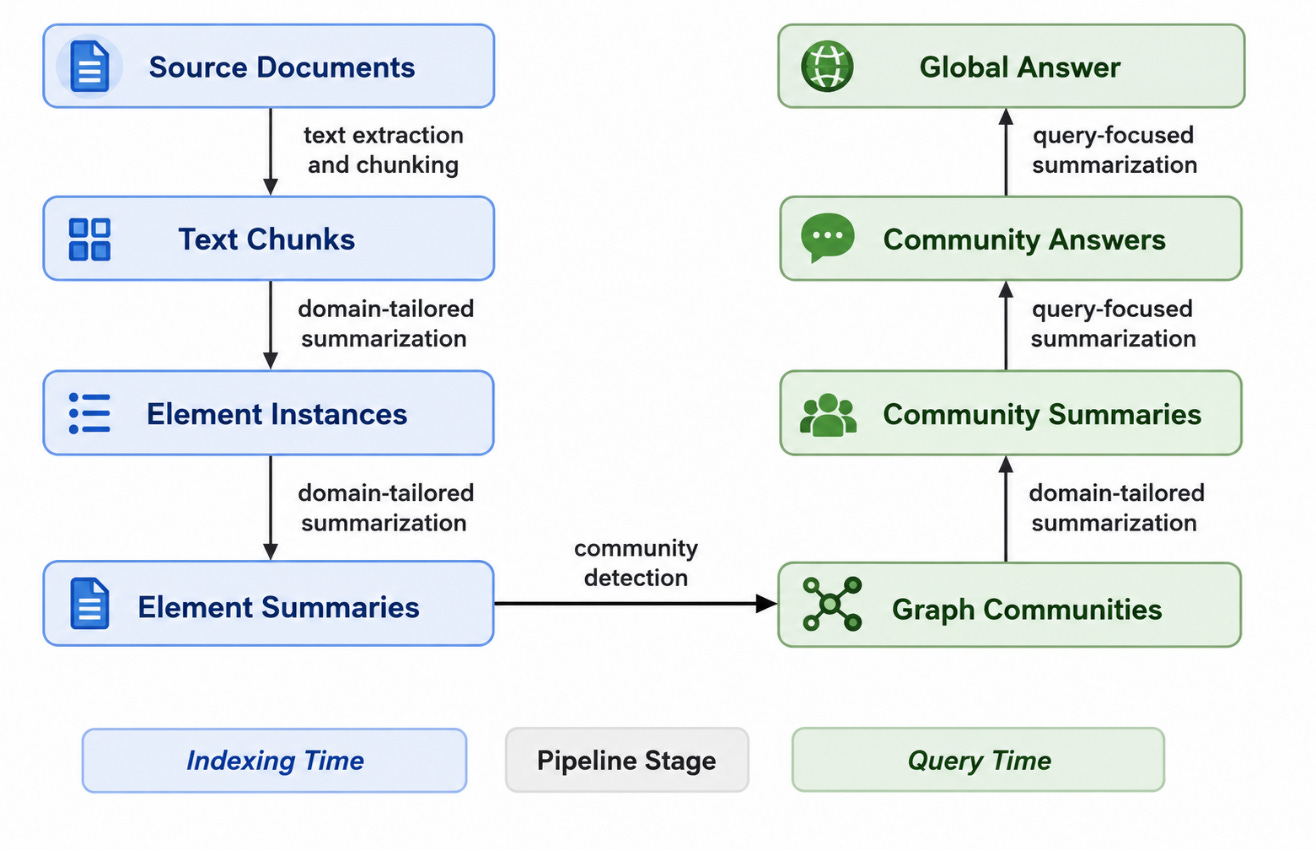
Think of it like organizing a huge library…
Instead of reading every book whenever someone asks a broad question, you first group related books into sections and create a summary for each section.
At query time, GraphRAG uses these summaries to answer big-picture questions about the dataset without examining every entity & relationship individually.
GraphRAG vs Microsoft GraphRAG
GraphRAG is a general approach to RAG.
Instead of relying only on similar text chunks, it uses a Knowledge Graph to connect related entities & information.
Microsoft GraphRAG is a specific implementation of this idea…Its pipeline includes:
Community detection
Community summaries
Entity & relationship extraction
Different retrieval methods--Local Search & Global Search
Think of GraphRAG as the idea of making pizza and Microsoft GraphRAG as one specific pizza recipe.
The idea tells you what you are trying to build… The recipe gives you specific steps for how to build it.
Next, let’s look at Knowledge Graphs & how they “connect” information…
§
Knowledge Graph
Let’s start with the basic building blocks:
Nodes, Edges, and Properties
A Knowledge Graph3 shows how different pieces of information connect:
Nodes: Things in the graph, such as a person, company, product, or place
Edges: Relationships connecting those things
Properties: Extra information about nodes/relationships
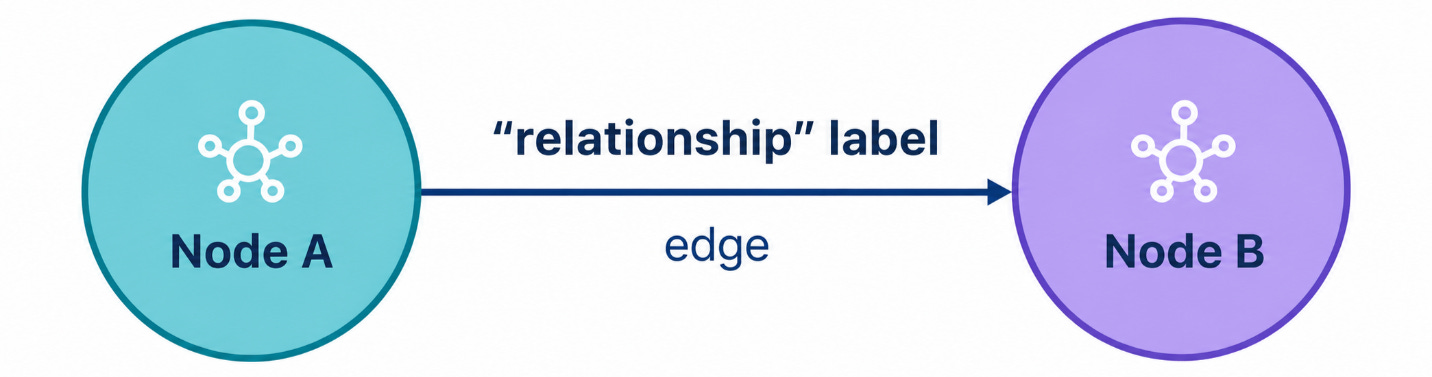
Graph Models
A “basic graph” tells you what connects to what…While a “property graph” tells you what those things are & what the connection means.
Think of a knowledge graph as a map of knowledge and a property graph as a way of putting extra details on that map.
Let’s understand it with an example:
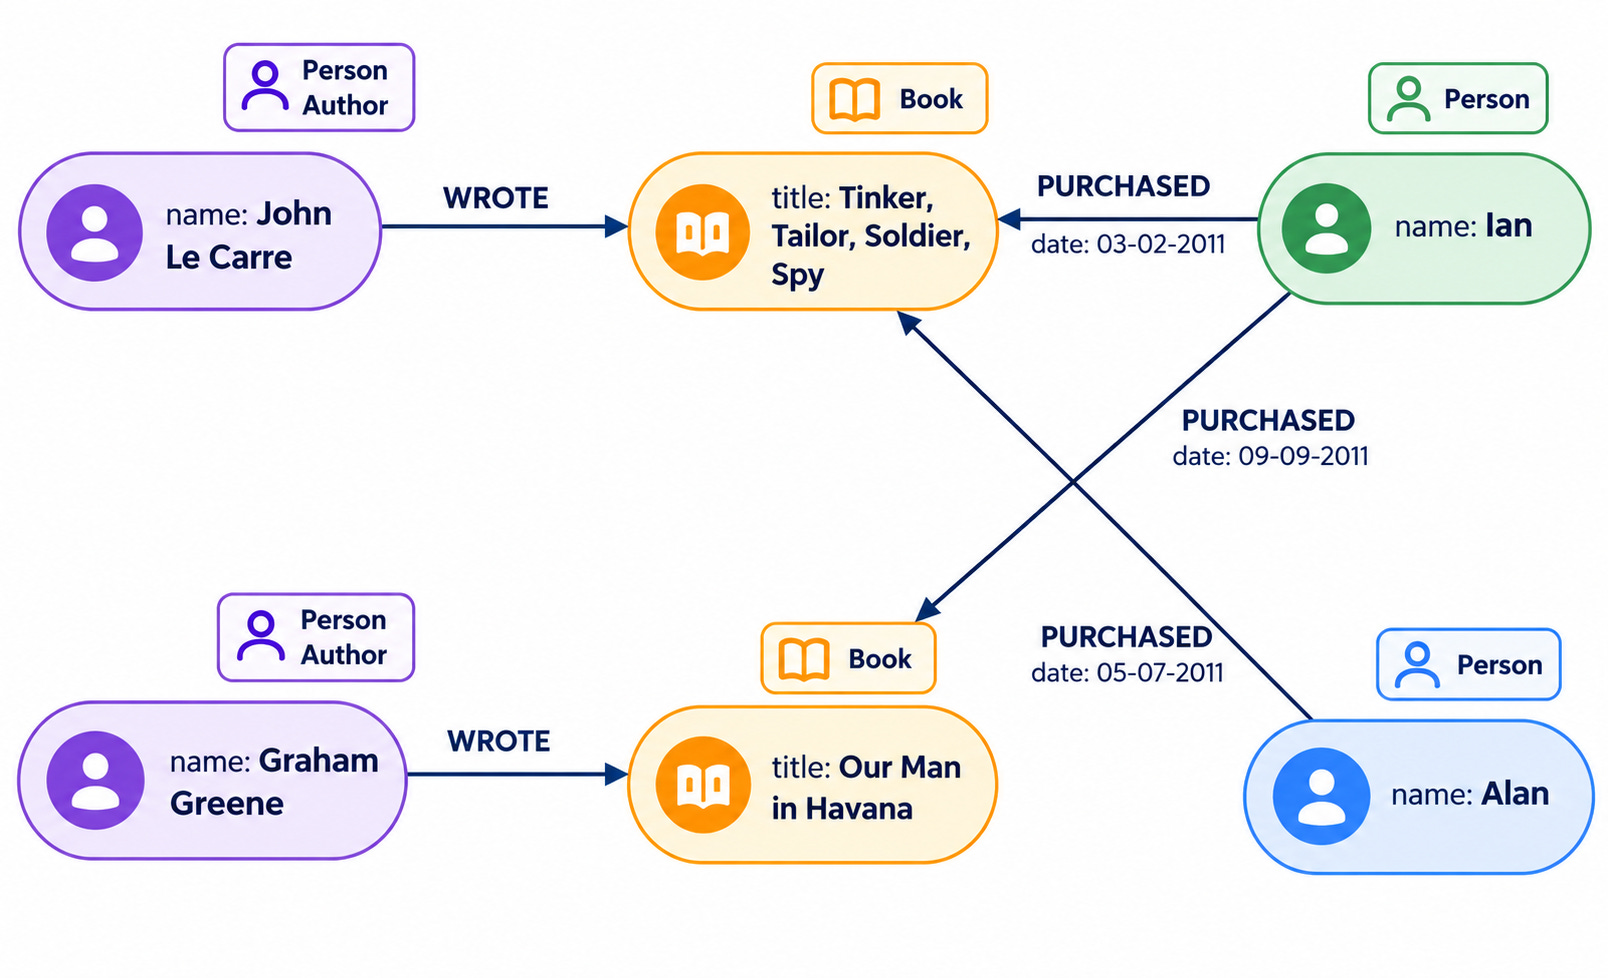
Knowledge Graph = Connected Facts
John Le Carré → WROTE → Book
Property Graph = Connected Facts With Extra Details
John Le Carré → WROTE → Tinker, Tailor, Soldier, Spy ← PURCHASED (03-02-2011) ← Ian
Resource Description Framework (RDF) is a standard way to represent & link information on the Web using triples.
A triplet is a basic unit of data in the graph.
And each triple contains three parts:
Subject → Predicate → Object
Subject: Node associated with the triplet
Object: Node receiving the relationship points
Predicate: Relationship between subject & object
So in the above example:
Subject: John le Carre, Graham Greene, Ian, Alan
Predicate: Wrote, Purchased
Object: Tinker, Tailor, Soldier, Spy
RDF lets users merge data from various sources without losing original details.
i.e., you query the complete global dataset instead of specific data instances. RDFs let knowledge graphs carry properties from different data management models.
Database: Organize data from many sources into a unified collection for querying & searching.
Graph: Allow analysis of a networked structure.
Knowledge Base: Store information collected from different sources to answer questions or support decisions.
RDF Schema and Ontologies
RDF Schema (RDFS) is a technique to describe classes & relationships with RDF data.
For example, you can define a person & book as classes and define relationships between them.
An ontology goes beyond a dictionary… It formally defines concepts in a domain and shows how they relate to one another.
A health domain ontology could define:
Researcher ──conducts→ Clinical trial
Clinical Trial ──studies→ Disease
Clinical Trial ──tests→ Drug
The ontology gives the graph meaning & a common vocabulary.
Graph Query Languages
Cypher & SPARQL (SPARQL Protocol & RDF Query Language) are 2 graph query languages.
Cypher is a query language used with property graphs.
It has syntax that directly specifies graph patterns:
MATCH (p:Person {name: "John le Carré"})-[:WROTE]->(b:Book)
RETURN b.title;
This query finds the person named John Le Carré.
It follows WROTE relationship to locate the connected book & return the book’s title.
SPARQL is a query language for RDF.
It operates on RDF triples rather than on property graph patterns:
PREFIX : <http://example.org/>

SELECT ?book
WHERE {
  :JohnLeCarre :wrote ?book .
}
These languages retrieve related information, but they use different graph models.
This is key for GraphRAG retrieval… Queries fetch data from relationships, not just similar meanings.
Vector Database and Knowledge Graph
Vector databases find information based on similarity.
A knowledge graph is a collection of entities & their relationships. You link entities & explore how they relate to each other.
i.e., vector search finds relevant information…while knowledge graphs link the dots.
Check this example:
Who has written research papers on Alzheimer’s disease?
This involves multiple relationships:
Researcher → Published → Paper → Studies → Disease → Treatment
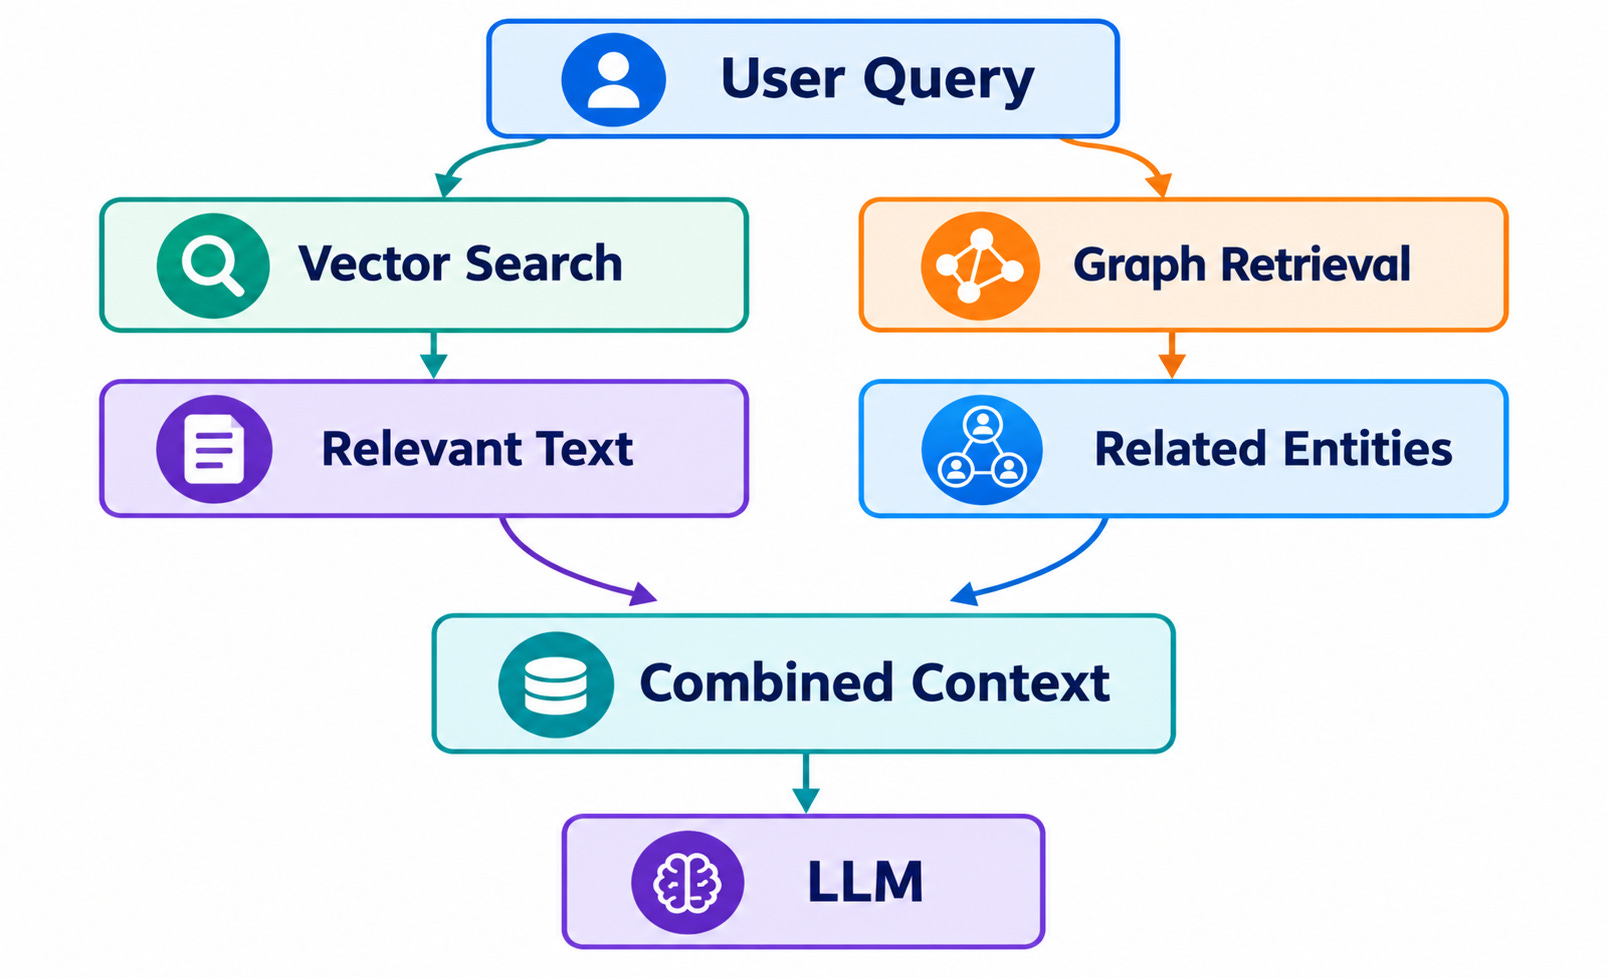
Also they could work together:
Vector search finds relevant papers, but it doesn't represent specific relationships in the vector space.
A knowledge graph directly stores these relationships, thus making it easier to track multi-step questions.
How to Choose Between Graph and Vector Databases
Before choosing a database, answer these questions4:
What types of data will you store: documents, embeddings, entities, or relationships?
Do queries rely primarily on semantic similarity or explicit relationships?
Do you need multi-hop traversal across connected entities?
Do you need to represent multiple relationship types & properties?
Do queries combine semantic retrieval with graph traversal?
What are your latency, throughput & scalability requirements?
How frequently will your data & relationships change?
Which query languages, APIs, and ecosystem integrations do you need?
Rule of thumb:
Use vector search for semantic similarity
Use graph databases for relationship-heavy queries, and hybrid retrieval when you need both.
Ontology and Schema Design
Before building a Knowledge Graph, decide which entities, relationships, and properties it should contain.
A schema defines the structure of your graph, while an ontology describes the meaning of its concepts and relationships.
For example, in a medical research knowledge graph:
Entities: Researcher, Paper, Disease, Treatment
Relationships: AUTHORED, STUDIES, TREATS
Properties: Name, publication date, research field
There are two popular approaches to schema design:
1. Top-Down Schema Design
Start with a domain model that defines the entities & relationships…Then build the graph according to that model.
Think of building a house. You create the blueprint first, then construct the house.
Similarly, you define the graph’s structure before adding data.
When to use it: When you know the domain well and need consistent terminology and relationships.
2. Bottom-Up Schema Design
Start with the available data.
Identify important entities and relationships, then use them to develop the schema.
Imagine having a collection of building materials. You inspect what is available before deciding how to design the house.
When to use it: When you have massive collections of unstructured documents and don’t know all the relationships in advance.
In practice, you can combine both approaches…
Start with a basic schema, extract entities and relationships from your documents, then refine the schema as you discover new patterns.
Common Schema Design Pitfalls
Without rules for growth, a knowledge graph becomes hard to manage.
Here are 5 common mistakes:
Duplicate entities: The same real-world entity appears as multiple nodes. For example, “John Smith” and “J. Smith” might refer to the same researcher but exist as separate nodes.
Missing relationships: Important connections between entities are absent. For example, a Student and Course exist as nodes, but the ENROLLED_IN relationship between them is missing.
Overly complex schemas: Too many entity types, relationships, and/or properties make the graph difficult to understand & query. For example, storing every student’s phone number, age, and email address as separate nodes when simple properties would be enough.
Inconsistent relationship names: Different names describe the same relationship. For example, AUTHORED, WROTE, and IS_AUTHOR_OF might represent the same connection between a researcher and a paper.
Schema designed for a single query: A graph built to answer one specific question might struggle with new questions. For example, a university graph designed only to find students enrolled in courses might lack the relationships needed to identify their instructors.
The goal is not to model every possible detail…
Instead, design a graph that captures the entities and relationships your application needs, while leaving room for new use cases.
Let’s see how GraphRAG uses this structure to retrieve information and generate answers…
§
Graph RAG Pipeline
GraphRAG combines knowledge graphs with RAG to find information, follow relationships & generate answers grounded in relevant evidence.
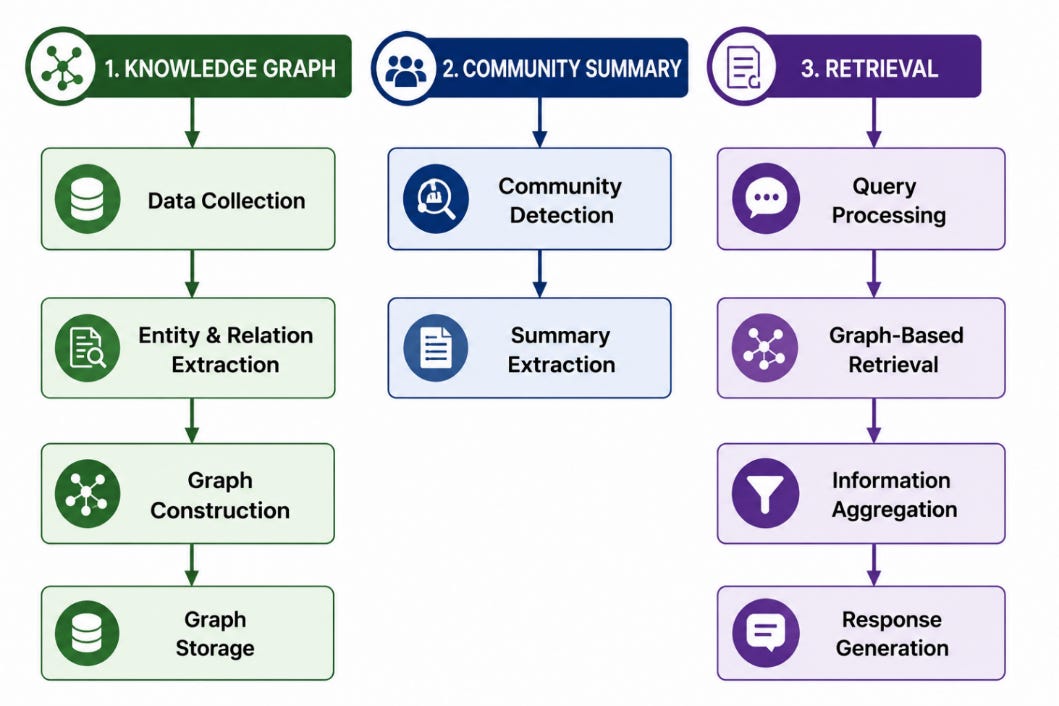
The pipeline has 3 key stages:
Build & store the knowledge graph.
Detect communities & generate summaries.
Retrieve relevant information & generate an answer.
Let’s dive in!
Step 1: Knowledge Graph Creation
Convert raw documents into a structured graph of entities & relationships.
1. Data Collection
Collect information from sources such as books, articles, research papers & internal documents.
For example, a medical research system processes thousands of papers about diseases, treatments, and clinical trials.
2. Entity and Relationship Extraction
Identify important entities & relationships between them.
You could use LLMs, Named Entity Recognition (NER), and/or rule-based methods.
Consider this sentence:
“Dr. Smith authored a paper about a new treatment for Alzheimer’s disease.”
The extraction process identifies:
Entities: Dr. Smith, Research Paper, Treatment, Alzheimer’s Disease
Relationships: AUTHORED, STUDIES, TREATS
Also, the system should resolve duplicate entities & validate extracted relationships before adding them to the graph.
3. Graph Construction
Turn the extracted information into nodes, edges & properties:
Nodes: Represent entities such as researchers, papers, diseases & treatments.
Edges: Connect related entities through relationships such as AUTHORED.
Properties: Store extra details such as names, publication dates, and research fields.
For example:
Dr. Smith → AUTHORED → Research Paper → STUDIES → Alzheimer's Disease
The result is a graph that captures both information & how different facts connect.
4. Graph Storage
Store the graph in a graph database like Neo4j, Amazon Neptune, TigerGraph, or NebulaGraph.
Graph databases support relationship traversal & pattern matching.
You could query a graph to find all researchers who authored papers about treatments for a specific disease.
Neo4j is a common GraphRAG choice because it supports the Cypher query language, graph algorithms, and vector indexes.
Plus, you could combine5 a graph database with a specialized vector database such as Milvus, Pinecone, or Weaviate.
This gives your retrieval system access to semantic similarity & explicit relationships.
Step 2: Community Detection and Summaries
A large knowledge graph might contain millions of nodes & relationships.
And searching the entire graph for every question is going to be expensive.
Community detection organizes the graph into related groups…
1. Community Detection
A community is a group of nodes with relatively strong connections to one another.
Think of your social network:
You have friends, family members & coworkers. Each group forms a community because its members often share stronger connections with one another than with people outside the group.
Knowledge graphs work similarly…
A medical research graph might contain communities focused on cancer research, cardiovascular diseases, and neurological disorders.
Community-detection algorithms identify these groups based on the graph’s structure.
Here are the popular approaches:
Leiden: Finds communities & refines their structure.
Louvain6: Groups nodes by optimizing modularity, a measure of community structure.
Label Propagation7: Groups nodes by repeatedly propagating labels across their connections.
2. Community Summaries
Once the system identifies communities, an LLM summarizes each group.
A community about Alzheimer’s disease might include researchers, treatments, clinical trials & related papers. The LLM examines the available entity descriptions and relationships, then creates a report about the community.
These reports help GraphRAG answer broad questions without retrieving every individual node & relationship.
For example:
“What are the major research trends in Alzheimer’s treatment?”
Instead of examining thousands of disconnected facts at query time, system uses relevant community reports to identify important themes.
Step 3: Retrieval and Response Generation
Once the graph & community reports are ready, GraphRAG answers user questions.
The retrieval process has 4 parts:
1. Query Processing
System analyzes user’s question to identify relevant entities, relationships & search intent.
For example:
“Who are friends of my friends?”
In a social network graph, system starts from your user node & follows two friendship relationships.
You could express this with Cypher:
MATCH (:User {userId: 'referenceUser'})
      -[:FRIEND]->
      (:User)
      -[:FRIEND]->
      (fof:User)
RETURN DISTINCT fof
In a real app, you’d filter out original user & exclude existing direct friends.
The same principle applies to GraphRAG: start with relevant entities and follow meaningful relationships.
2. Graph-Based Retrieval
The system retrieves a relevant portion of the knowledge graph - subgraph.
It uses 2 techniques:
Subgraph Extraction: Find entities & relationships directly relevant to question.
Context Expansion: Follow additional relationships to gather supporting evidence.
For example, you ask:
“Which researchers are studying treatments for Alzheimer’s disease?”
Here’s what system would do:
Find Alzheimer’s Disease node.
Follow relationships to relevant treatments & research papers.
Find the researchers who authored those papers.
Retrieve supporting text from the original documents.
You control how far system explores using hop limits, relationship filters, and relevance scores.
This prevents retrieval from expanding into unrelated parts of the graph.
3. Information Aggregation
Combine retrieved entities, relationships & supporting text into context for LLM.
The system would collect:
Researchers & their publications
Treatments discussed in those publications
Relationships between treatments & diseases
Supporting passages from research papers
The goal is to give the LLM enough evidence to answer the question without overwhelming it with irrelevant information.
4. Response Generation
LLM uses the retrieved context to generate a natural-language answer.
It identify researchers studying Alzheimer’s treatments and explain which papers support those connections.
When the system preserves source references, it also cite documents behind its answer. The key difference is GraphRAG retrieves information through both relevance & relationships.
Vector search helps find semantically similar content.
Graph traversal helps uncover how entities connect.
They provide a richer context for questions that depend on many connected facts.
Now we understand GraphRAG… when should we use it instead of standard RAG?
GraphRAG vs Standard RAG: when to use each
GraphRAG complements traditional vector RAG…Each approach serves different retrieval needs.
Consider using GraphRAG when:
Your documents contain relationships between entities, events, concepts.
Questions must draw connections between facts, follow a sequence, or look for patterns.
Answers require identifying themes, patterns, trends across an entire dataset.
You need to explore dependencies or trace connections between entities.
Your app benefits from structured, relationship-aware retrieval, such as legal research, scientific research, fraud investigation.
Consider using Vector RAG when:
Questions require straightforward factual lookups, such as “What is our annual leave policy?”
Relevant information is available in one or a few retrieved chunks.
Semantic similarity is sufficient to find the required information.
You want a simple retrieval architecture with lower indexing & maintenance overhead.
§
Reminder: this is a teaser of the subscriber-only newsletter, exclusive to my golden members.
When you upgrade, you’ll get:
High-level architecture of real-world systems.
Deep dive into how popular real-world systems work.
How real-world systems handle scale, reliability & performance.
(If this newsletter has helped you become a better software engineer, consider subscribing to support my work.)
§
GraphRAG Retrieval Strategies
Let’s see how GraphRAG finds the right information: