

A Crash Course on High Availability
#126: What Is High Availability

Share this post & I'll send you some rewards for the referrals.
Block diagrams created using Eraser.
Why should we care about uptime? And what exactly is high availability?
Downtime is expensive…
A payment system that goes down during peak shopping hours bleeds revenue. A hospital record system that crashes mid-shift puts patients at risk. An app going offline for ten minutes triggers trending hashtags from angry users.
Downtime is never abstract…
It translates into lost money, lost trust, and sometimes even legal penalties. Some of it can never be recovered. High availability started long before the cloud. In the 1960s, defense and finance systems had to run nonstop. Those engineers designed machines that could keep working even when parts failed. When the internet arrived, that same discipline moved online. Banks, retailers, and payment networks learned that a brief outage can erase months of profit.
With the widespread use of technology, the expectation of “always on” has never been greater. Now, uptime is not a luxury but a baseline.
The goal never changed: build systems that keep running when the world shakes.
So failures will happen. No matter how hard we try, we can’t avoid them. Hardware burns out, networks drop packets, software engineers create bugs. High availability (HA) is about absorbing those failures behind the scenes…it’s about the service being available regardless of failures.
People don’t think about their car tires until one goes flat.
High availability is having a spare one in the trunk. After we replace them, we can drive again. We can’t always control why the tire got flat, but we can carry a spare one. This is the core idea of high availability.
Now let’s put some numbers to it.
Onward.
The best way to build any app (Partner)

Treat your app like an Orchid: A beautiful flower that needs sunlight and a bit of water 🌸
Most “AI builders” make you grow your app in their pot. Same stack. Same limits. Same rules. And on their databases.
Orchids is different:
It’s your build space, set up your way.
Build anything, Web app, mobile app, Slack bot, Chrome extension, Python script, whatever.
Bring your own AI subscriptions so you’re not paying twice.
Plug in the database you already use and trust.
Use any payment infra you want.
Try Orchids.app and build it the way you were meant to:
(Thanks, Orchids, for partnering on this post.)
Use this discount code to get a one time 15% off during checkout: MARCH15
Fundamentals
HA means keeping a system running even when parts of it fail.
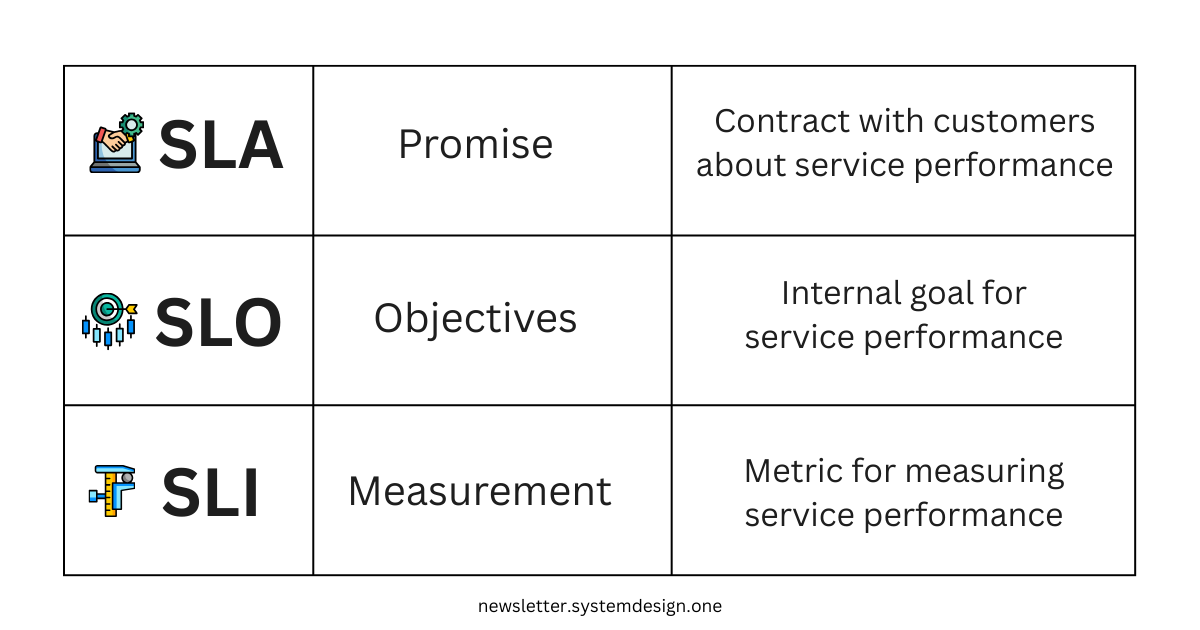
The higher the availability, the less impact each individual failure has. To manage HA, engineers use SLAs, SLOs, and SLIs. These turn vague ideas like “keep it up and running” into numbers we can measure:
Service Level Agreement (SLA): Contract with customers about service performance.
This contract keeps a record of what the service provider promises to deliver
There are penalties or costs if the contract is not respected
In HA, this is an agreement about how much downtime is acceptable
For example, “our app will be online 99.9% of the time. If not, we’ll give your money back.”
Service Level Objective (SLO): Specific internal goal for the service performance.
This is the target that internal teams are trying to hit with a desired metric
Your SLA is the minimum you promise customers; your SLO is the better performance you target internally
For example, if the SLA is 95% uptime, the SLO might be 98% to leave a 3% safety margin
Service Level Indicator (SLI): Metric used to measure service performance.
Without measuring service performance, we can’t know if we’re hitting the targets
These metrics should reflect the SLO and SLA
For example, “Percentage of failed requests.”
Let’s illustrate it with an example:
A restaurant promises customers that their food will be delivered within 20 minutes of ordering (SLA).
The kitchen aims to finish orders in 15 minutes to stay ahead (SLO).
They track the average order completion time (SLI).
These targets get expressed in “nines of availability”.
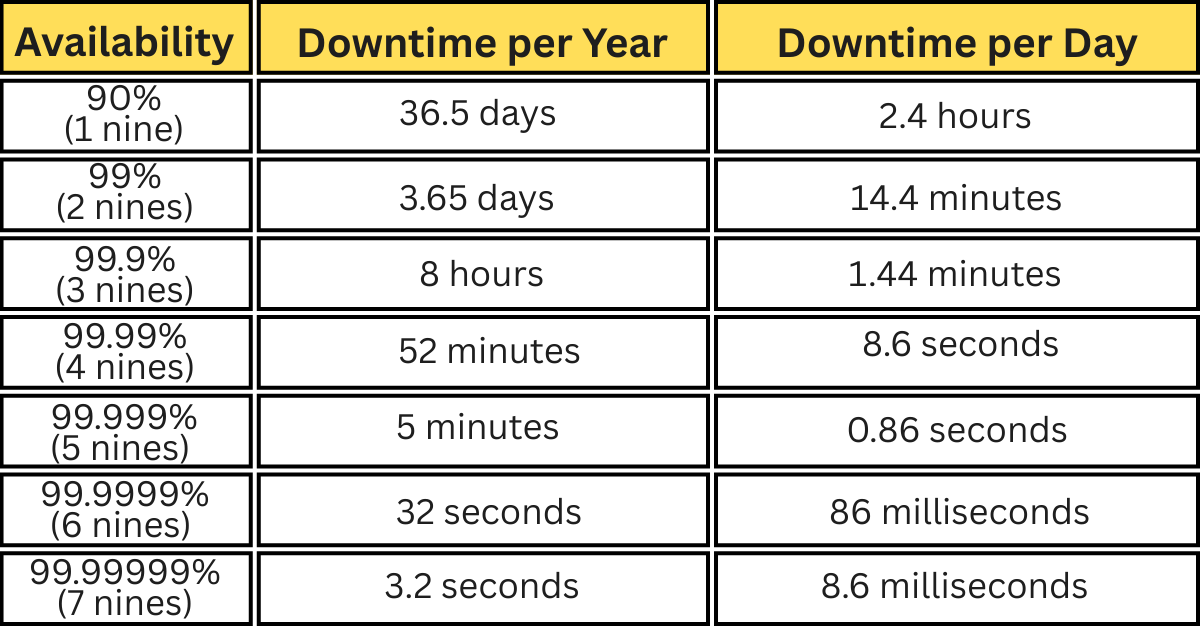
One nine means 90% uptime; two nines mean 99%; and so on…
Each extra nine sounds small, but cuts downtime by a ton. For example, 99% uptime allows over 3 days of outage a year, while 99.9% (“three nines”) allows only about 8 hours. Every nine added costs more. It needs better hardware, more redundancy, and more monitoring.
The closer you aim for perfect uptime, the more effort and money it takes to maintain it.
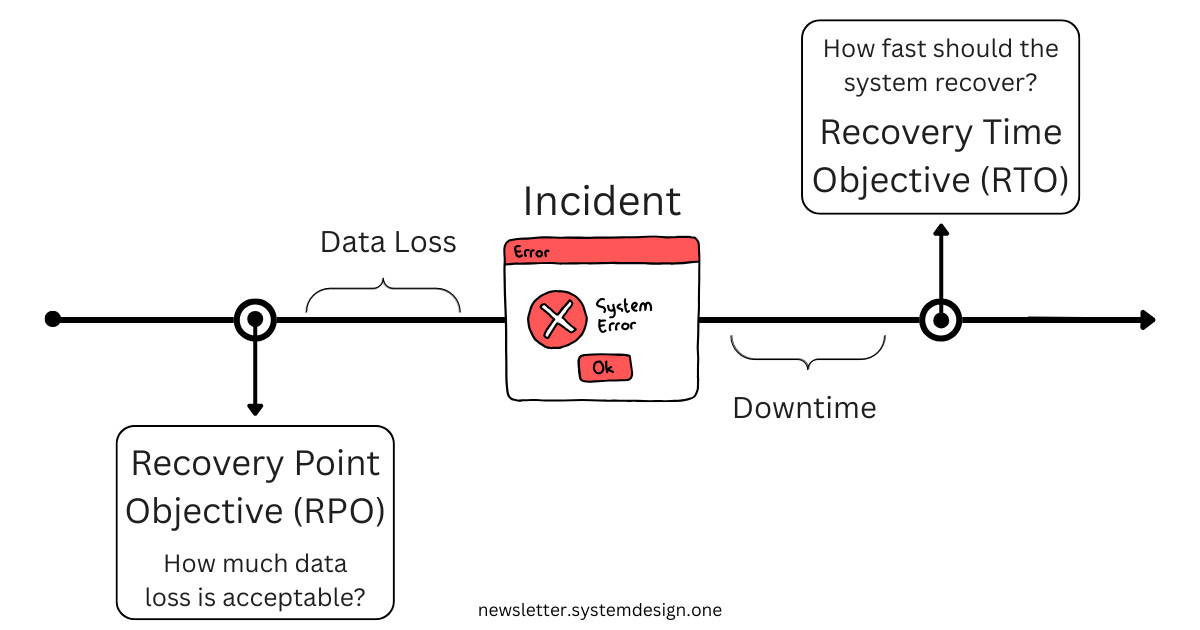
When failures occur, recovery metrics help us measure how quickly and effectively we can recover. Here are the most important ones:
Recovery Time Objective (RTO)
How fast should the system recover from failure? How long can it be down for?
Larger RTO means more downtime is acceptable; smaller RTO means less downtime
For example, an RTO of 10 minutes means that the system should be able to recover within 10 minutes of failing
Recovery Point Objective (RPO)
To what point in time does the system recover? How much data loss is acceptable?
Larger RPO means more data loss, smaller RPO means less
For example, an RPO of 5 minutes means 5 minutes of data gets lost
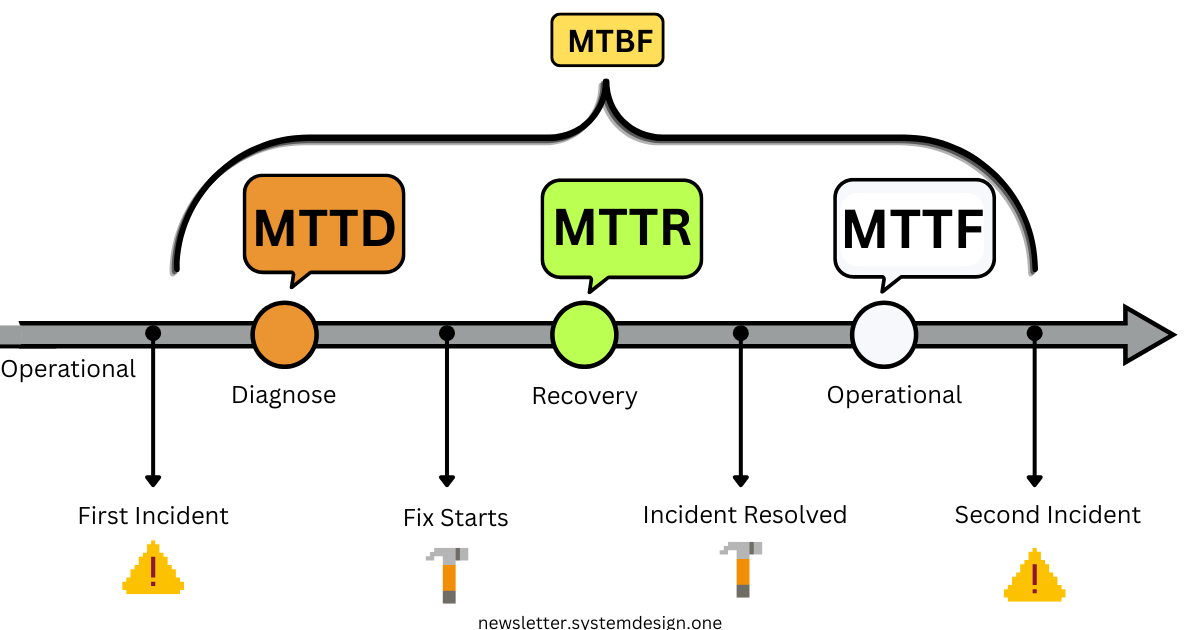
MTTD (Mean Time to Detect)
This is the mean time needed to notice a failure
How long does it usually take for the system or team to detect that something is wrong?
Smaller MTTD means faster detection; larger MTTD means slower detection
For example, an MTTD of 30 seconds means issues get found half a minute after they occur on average
MTTR (Mean Time to Repair)
This is the mean time needed to fix a failure. How long does the system usually take to recover?
Larger MTTR means more time to recover, smaller MTTR means less
For example, an MTTR of 5 minutes means the failure will take 5 minutes to recover on average
MTBF (Mean Time Between Failures)
This is the mean time between two failures. How often does the system usually fail?
Larger MTBF means failures happen less often & vice-versa
For example, an MTBF of 1h means failures usually happen every hour
MTTF (Mean Time to Failure)
This metric is designed for non-recoverable components. How long is the lifespan of this component?
This metric differs from MTBF because it lacks a recovery component. The component is alive, and then it crashes without recovery. MTTF is the time between those two points.
A larger MTTF means a component has a longer lifespan, and a smaller MTTF means a shorter one
For example, an MTTF of 3 years means a component usually lasts for 3 years before becoming unusable
Availability Formula
Availability links uptime & downtime in one line:
Availability = MTBF / (MTBF + MTTR)If the system runs for 1000 hours before a 1-hour fix, uptime is 99.9%.
Every extra nine costs more to achieve. Past “three nines,” you buy less outage and pay more in redundancy, automation, and testing.
Takeaway:
HA is measurable. Metrics turn abstract goals into clear engineering targets.
What gets measured gets managed.
Ready for the best part?
Reminder: this is a teaser of the subscriber-only post, exclusive to my golden members.
When you upgrade, you’ll get:
Full access to System Design Case Studies
FREE access to (coming) Interview Academy
FREE access to (coming) Design, Build, Scale newsletter series
And more!
Get 10x the results you currently get with 1/10th the time, energy & effort.
Keep reading with a 7-day free trial
Subscribe to The System Design Newsletter to keep reading this post and get 7 days of free access to the full post archives.