How Uber Computes ETA at Half a Million Requests per Second
#26: And How Online Maps Work Explained Like You’re Twelve (5 minutes)
Get my system design playbook for FREE on newsletter signup:
This post outlines how Uber computes ETA accurately at half a million requests per second. If you want to learn more, scroll to the bottom and find the references.
Share this post & I'll send you some rewards for the referrals.
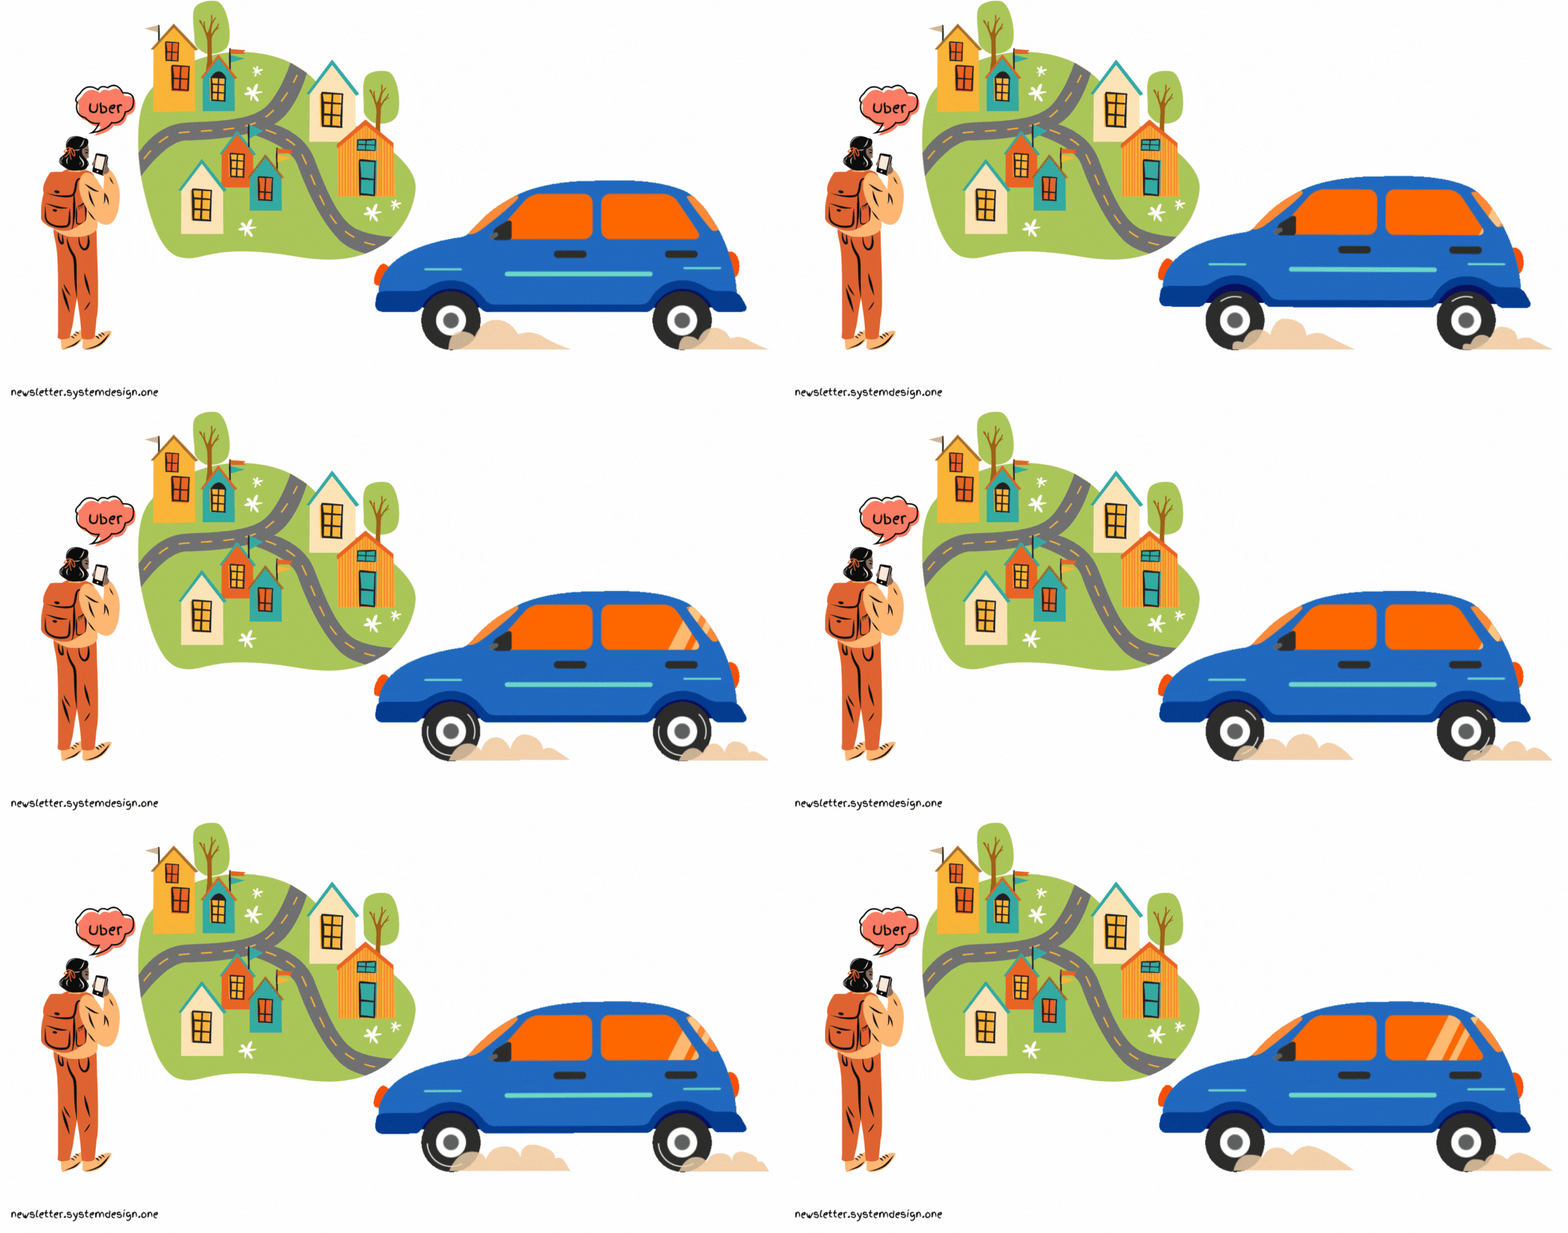
September 2014 - Prague, Czech Republic.
Maria has an important meeting in 15 minutes.
She calls a taxi.
But the trip took a lot longer than expected.
So she was late and upset.
She hears about the new ride-sharing app called Uber from a coworker.
She installs it immediately and was dazzled by the ETA accuracy.
Weekly Olio (Featured)
Knick-knacks on tech, startups, business, and life. Read by 25k+ people from around the world, Weekly Olio already counts the who’s who of investors, startup founders, economists, and industry professionals among their subscribers. You can be one too!
The time estimated to travel from point A to B is called the Expected Time of Arrival (ETA).
Uber computes ETA in 4 scenarios:
Eyeball: when the rider enters a destination in the app
Dispatch: to find a car to pick up the rider in the shortest waiting time
Pick up: to find the time needed to pick up the rider
On-trip: to provide live updates on time to reach the destination
A single trip usually takes around 1000 ETA requests.
Yet computing ETA is a difficult problem. Because the distance between the source and destination is not a straight line.
Instead it consists of complex street networks and highways.
The smart engineers at Uber used simple ideas to solve this difficult problem.
Uber ETA
Here’s how Uber computes ETA accurately at extreme scales:
1. Routing Algorithm
They represent the physical map as a graph.
Every road intersection is modeled as a node.
While every road segment is modeled as a directed edge.
So computing ETA becomes finding the shortest path in a directed weighted graph.
Dijkstra’s algorithm is known for finding the shortest path in a graph.
But the time complexity of Dijkstra’s algorithm is O(n logn). And n is the number of road intersections or nodes in the graph.
San Francisco Bay Area alone has half a million road intersections. So Dijkstra’s algorithm is not enough at Uber's scale.
So they partitioned the graph. And then precomputed the best path within each partition.
Thus interacting with boundaries of graph partitions is enough to find the best path.
Imagine a dense graph mapped to a circle.
Every single node in the circle must be traversed to find the best path between 2 points.
So time complexity would be the area of the circle: pi * r^2
While partitioning and precomputing make it more efficient.
It becomes possible to find the best path by interacting with only the nodes on the circle boundary.
So time complexity would be the perimeter of the circle: 2 * pi * r
Put another way, the time complexity to find the best path in the San Francisco Bay Area gets reduced from 500 Thousand to 700.
2. Traffic Information
The traffic on the road segments must be considered to find the fastest path between 2 points.
While traffic is a function of the time of the day, weather, and number of vehicles on the road.
They used traffic information to populate the edge weights of the graph. Because it makes the ETA more accurate.
Besides they combined aggregated historical speed information with real-time speed information. Because extra traversal data makes traffic information more accurate.
3. Map Matching
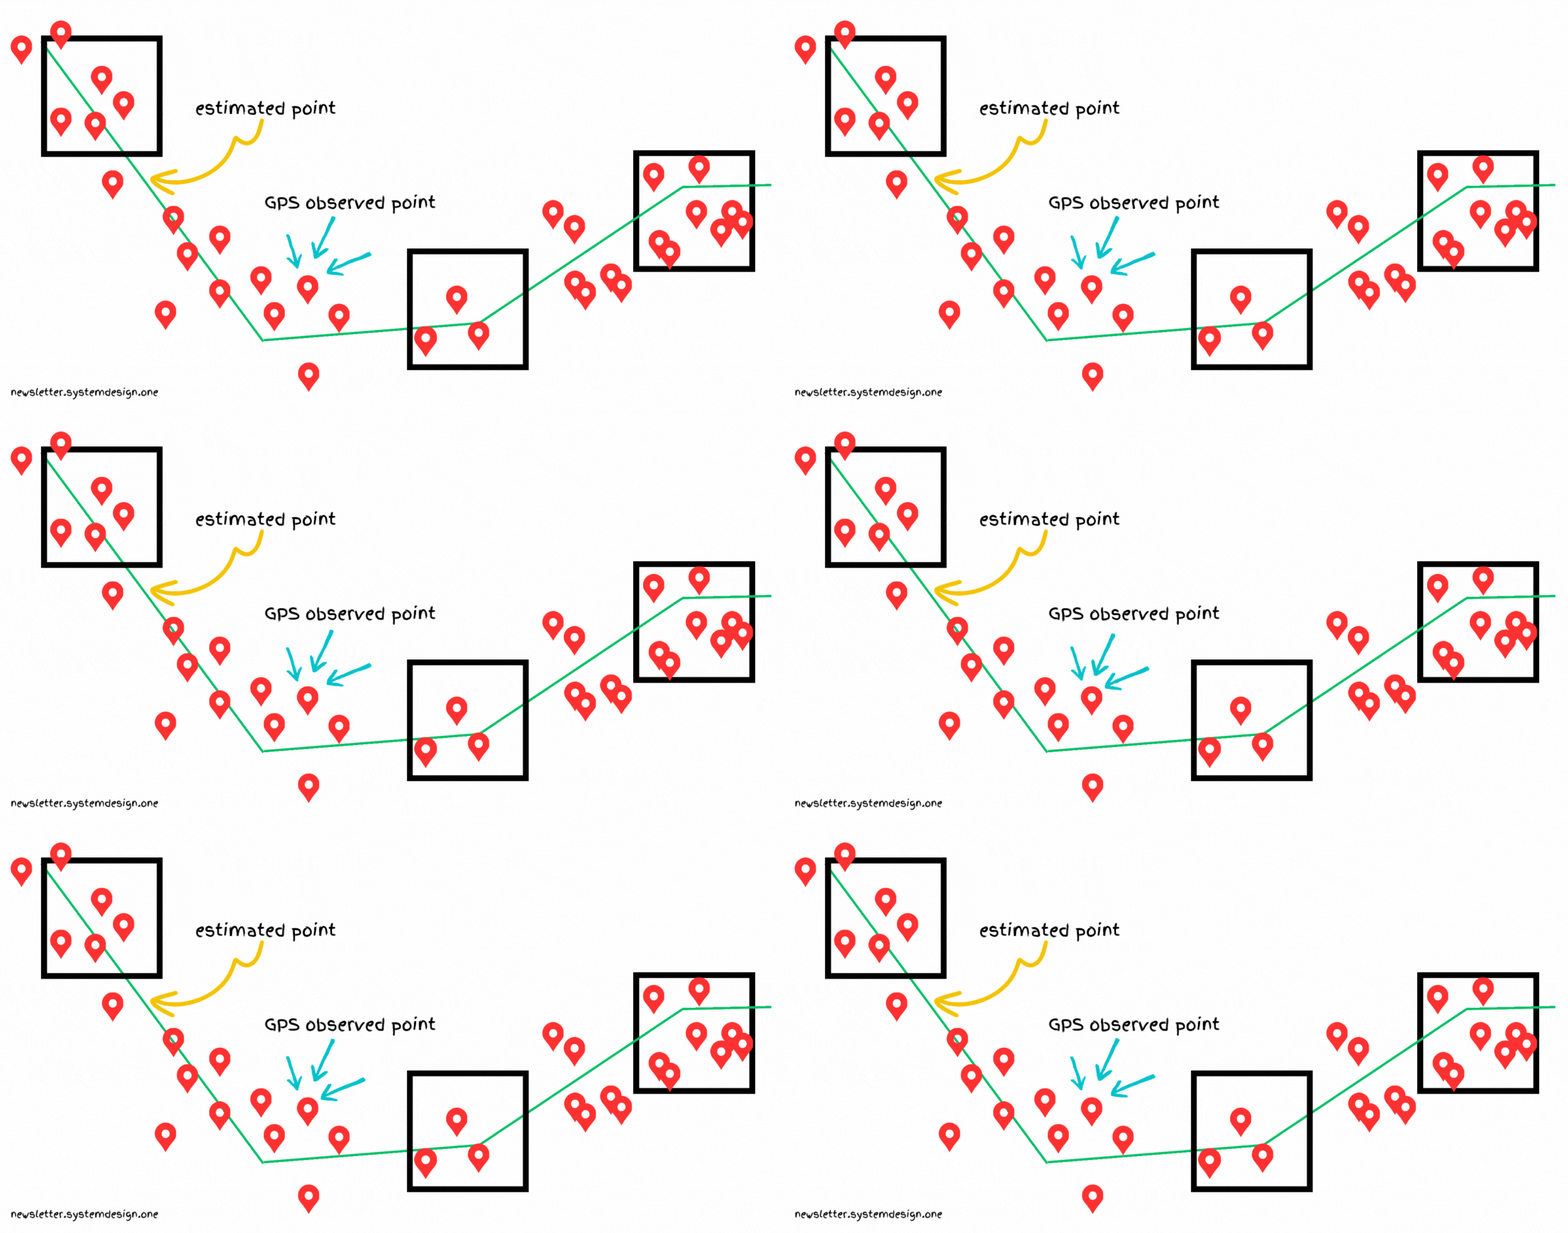
GPS signals can get noisy and sparse especially when the vehicle enters a tunnel.
Also the multipath effect could worsen the GPS signal. The multipath effect occurs when buildings reflect the GPS signal.
A poor GPS signal decreases the ETA accuracy.
So they do map matching to find the best ETA.
Map matching works by mapping raw GPS signals to actual road segments.
They use the Kalman filter for map matching. It takes GPS signals and matches them to road segments.
Imagine the Kalman filter as a person who makes a correct guess about something's location. The new and old information is taken into consideration for guessing.
Besides they use the Viterbi algorithm to find the most probable road segments. It's a dynamic programming approach.
Imagine the Viterbi algorithm as a person who figures out the correct story even if some words were spelled wrong. They do that by looking at the nearby words and fixing the mistakes so that the story makes more sense.
A rider is likely to avoid future trips if the actual trip time is higher than ETA.
Also more than 18 million Uber trips are completed daily.
So at Uber's scale, a bad ETA could cost them billions of USD in loss.
The current approach allowed them to scale to half a million requests per second.
👋 PS - Are you unhappy at your current job?
While preparing for system design interviews to get your dream job can be stressful.
Don't worry, I'm working on content to help you pass the system design interview. I'll make it easier - you spend only a few minutes each week to go from 0 to 1. Yet paid subscription fees will be higher than current pledge fees.
So pledge now to get access at a lower price.
"This newsletter is the perfect place to learn system design from big tech deep dives." Alexandre
Consider subscribing to get simplified case studies delivered straight to your inbox:
Thank you for supporting this newsletter. Consider sharing this post with your friends and get rewards. Y’all are the best.


I could surely use this any time my friends ask “what’s your ETA”... I always grossly underestimate how much time I need ha!
Great article with simple explanations. Very cool to find out how this works under the hood. Appreciate the article, NK